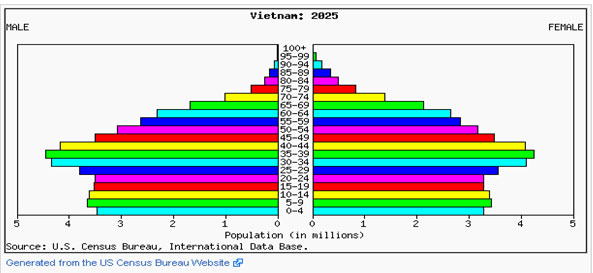
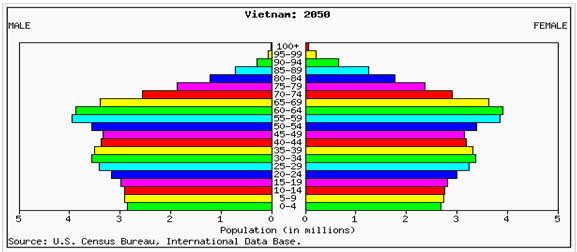
Comparing these two population pyramids of Vietnam, how are the male and female population graphs changing from 2025 to 2050?
A. There are more babies being born
Incorrect. It is projected that there will be less babies born by 2050 in Vietnam.
B. The people in this area are living longer
Correct! The general trend between the two pyramids demonstrates that the top of the pyramid is growing when compared with previous population pyramids.
C. Neither men or women are living to adulthood
Incorrect. Men and women both live to adulthood.
D. Men are outliving women over time
Incorrect. Overtime women outlive men in Vietnam.
What are the implications, suggested by the population pyramid, on government spending in Vietnam in 2050?
A. More child care facilities will need to be built
Incorrect. Children will not represent the largest percentage of the population.
B. More plans and programs for taking care of the large elderly population
Correct! By looking at the pyramid you can see that the elderly population will soon be the largest in the country.
C. More housing units to support the large number of college aged students.
Incorrect. College aged students do not represent the largest percentage of the population.
D. More elementary schools will be needed
Incorrect. Children of elementary school age will not represent the largest percentage of the population.
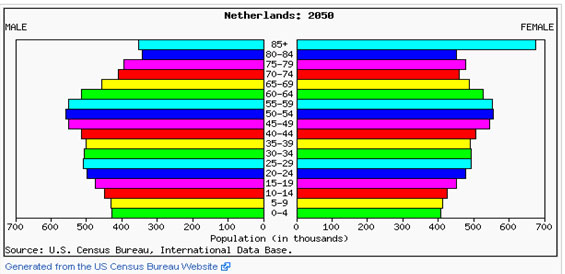
What are the implications, suggested by the population pyramid, on future government spending in the Netherlands?
A. An increased need for high schools
Incorrect. There is a group larger than high schools aged individuals.
B. An increased need for more universities
Incorrect. There is a group larger than university-aged individuals.
C. An increased need for importing diapers and baby formula
Incorrect. There is a group larger than 0-4 aged individuals.
D. An increased need in elderly care programs
Correct! You can tell that the elderly population of this country will soon be the largest and plans need to be made to take care of them.

What does the population pyramid tell us about the population in Vietnam in 2000?
A. Rapid Growth
Correct! We can tell by the shape of the pyramid that there are a lot of babies being born at this time.
B. Slow Growth
B. Slow Growth
C. Negative Growth
Incorrect. This pyramid does not reflect negative growth.
D. Stationary Growth
Incorrect. This pyramid does not reflect stationary growth.
What is the definition of Fertility Rate?
A. Subtract the mortality rate from the birthrate
Incorrect. This is the definition of the rate of natural increase.
B. The number of deaths among infants under age one per thousand live births
Incorrect. This is the definition of infant mortality rate.
C. Average number of children a woman of childbearing years would have in her lifetime
Correct! This is the definition of fertility rate.
D. The number of deaths per thousand people
Incorrect. This is the definition of mortality rate.
What is the definition of Birth Rate?
A. Average number of children a woman of childbearing years would have in her lifetime
Incorrect. This is the definition for fertility rate.
B. The number of live births per thousand population
Correct! This is how birth rates are calculated.
C. The number of deaths per thousand people
Incorrect. This is the definition for death rates.
D. The number of deaths among infants under age one per thousand live births
Incorrect. This is the definition for infant mortality rates.