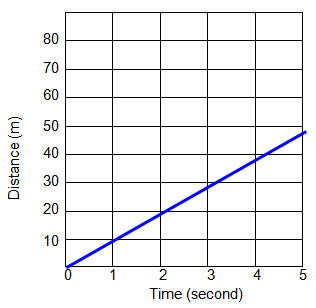
Incorrect. This object is traveling at a rate of 10 meters/second.
Correct!
Incorrect. This object is traveling at a rate of 20 meters per second.
Incorrect. This object is traveling at a rate of 3.33 meters per second.
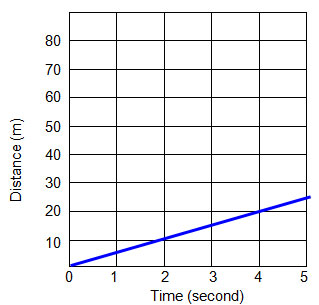
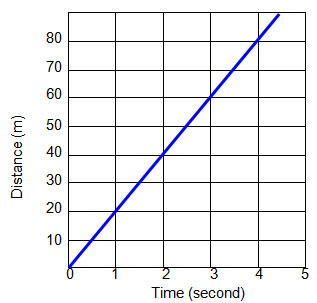
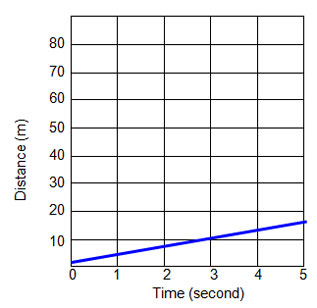
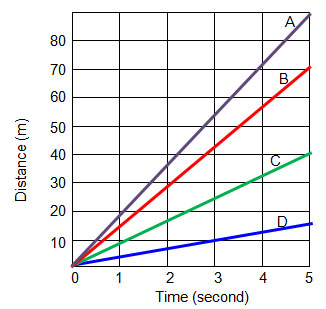
Which of the following graphs shows an object traveling at the average rate of 5 meters per second?
| A. Incorrect. This object is traveling at a rate of 10 meters/second. |
B. Correct! |
| C. Incorrect. This object is traveling at a rate of 20 meters per second. |
D. Incorrect. This object is traveling at a rate of 3.33 meters per second. |
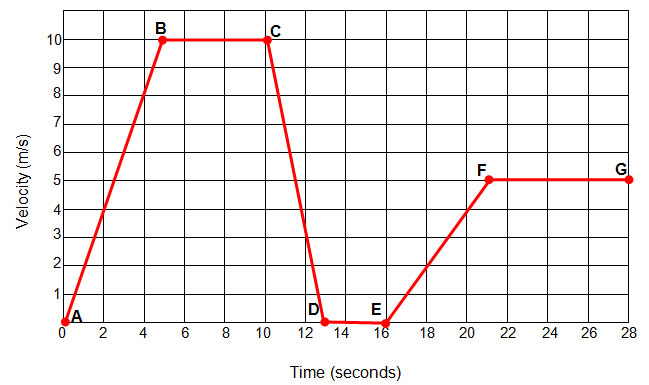
In the graph below, which object has the fastest speed?
A.
Correct! On a position vs. time graph, the steeper the line is, the faster the speed.
B.
Incorrect. Remember, on a position vs. time graph, the steeper the line is, the faster the speed is.
C.
Incorrect. Remember, on a position vs. time graph, the steeper the line is, the faster the speed is.
D.
Incorrect. Remember, on a position vs. time graph, the steeper the line is, the faster the speed is.
The graph below shows how the velocity of a bus changes during a trip. What is happening between segment B and C?
A. The bus has stopped.
Incorrect. On a velocity vs. time graph, a straight horizontal line indicates a constant velocity. The velocity at which it is moving is 10 m/s.
B. The bus is accelerating.
Incorrect. On a velocity vs. time graph, acceleration is represented by a straight upward slanted line.
C. The bus is moving at a constant velocity.
Correct! On a velocity vs. time graph, a straight horizontal line indicates a constant velocity.
D. The bus is decelerating.
Incorrect. On a velocity vs. time graph, deceleration is represented by a straight downward slanted line.
The graph below shows how the velocity of a bus changes during a trip. What is happening between segment C and D?
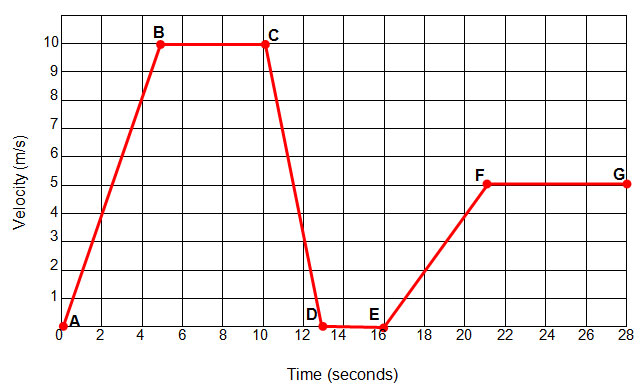
A. The bus is returning to its original starting position.
Incorrect. On a velocity vs. time graph, deceleration is represented by a straight downward slanted line.
B. The bus is traveling south east.
Incorrect. On a velocity vs. time graph, deceleration is represented by a straight downward slanted line.
C. The bus is accelerating.
Incorrect. On a velocity vs. time graph, deceleration is represented by a straight downward slanted line.
D. The bus is decelerating.
Correct! On a velocity vs. time graph, deceleration is represented by a straight downward slanted line.
The graph below shows how the velocity of a bus changes during a trip. Which segment shows the bus stopped?
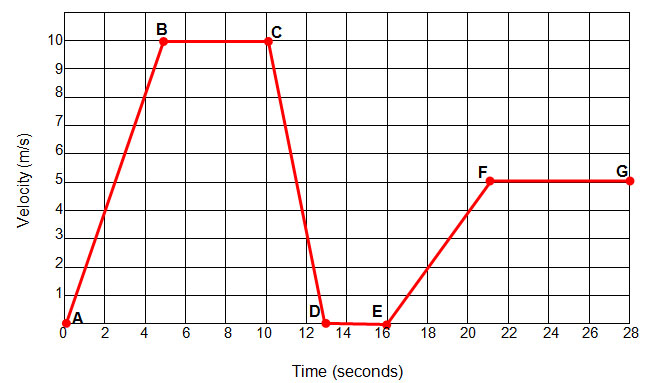
A. The segment between B and C
Incorrect. During this segment, the bus is traveling at a constant velocity of 10 m/s.
B. The segment between D and E
Correct! The velocity is 0 m/s, which means the bus is stopped.
C. The segment between F and G
Incorrect. During this segment, the bus is traveling at a constant velocity of 5 m/s.
D. The segment between C and D
Incorrect. During this segment, the bus is decelerating.