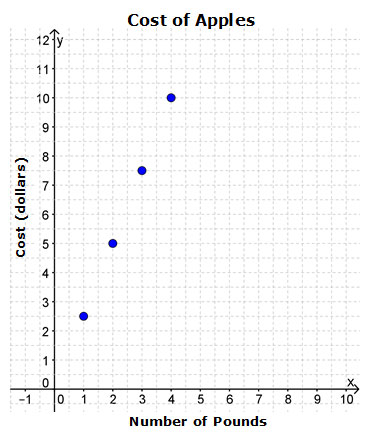
The graph below shows the cost of a certain number of pounds of apples.
Based on the information in the graph, which of the following unit rates best describes the cost per pound of apples?
A. $2.50 per pound
Correct!
B. $5.00 per pound
Incorrect. This number is the cost of 2 pounds of apples. Divide the cost by the number of pounds for each point on the graph to calculate the unit rate.
C. $7.50 per 3 pounds
Incorrect. While this number is a correct statement, it is not a unit rate. Remember that a unit rate has a denominator of 1 and relates the cost of apples to 1 pound of apples.
D. $10.00 per 4 pounds
Incorrect. While this number is a correct statement, it is not a unit rate. Remember that a unit rate has a denominator of 1 and relates the cost of apples to 1 pound of apples.
The graph below contains the total number of hours that Mrs. Johnson works in a given number of weeks for her part-time job.
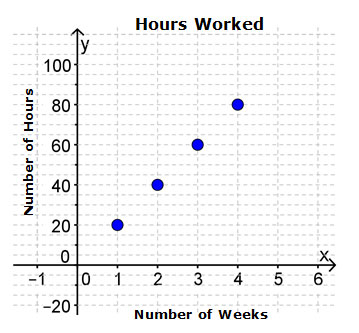
What is the slope of the line that best models the data shown?
A. 80
Incorrect. This number is the maximum y-value in the graph, but is not the unit rate used to determine the slope of this proportional situation.
B. 20
Correct!
C. 1 20
Incorrect. The unit rate used to determine the slope should be the number of hours per week, but this number represents the number of weeks per hour.
D. 1 4
Incorrect. The unit rate used to determine the slope should be the number of hours per week.
The graph below shows the number of miles that Sandra walked in a given number of hours.
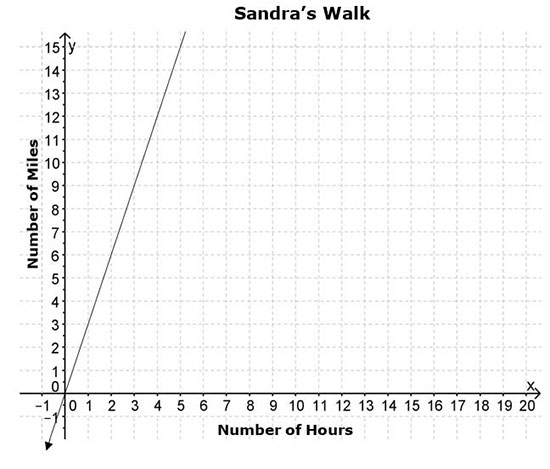
What is the unit rate for this situation?
A. 3 4 miles per hour
Incorrect. This number is the ratio of the largest number on the vertical axis to the largest number on the horizontal axis, but it is not the unit rate. Locate several points on the line, and use them to calculate the slope of the line, which is the unit rate of the situation.
B. 1 mile per hour
Incorrect. Locate several points on the line, and use them to calculate the slope of the line, which is the unit rate of the situation.
C. 3 miles per hour
Correct!
D. 20 miles per hour
Incorrect. Twenty is the largest number shown on the horizontal axis, but it is not the unit rate. Locate several points on the line, and use them to calculate the slope of the line, which is the unit rate of the situation.
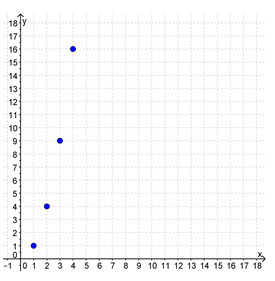
Which of the following graphs shows a proportional relationship with a slope of 4?
A.
Incorrect. This graph does not show a proportional relationship since the line connecting the points does not pass through the origin.
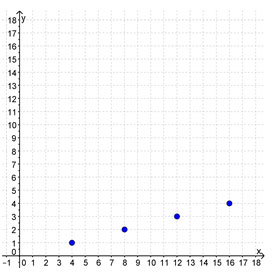
B.
Incorrect. This graph does not show a proportional relationship since the points cannot be connected with a straight line.
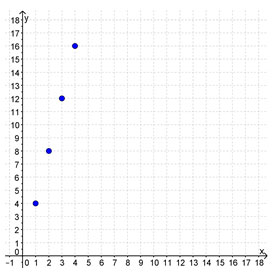
C.
Incorrect. This graph shows a set of points for a proportional relationship with a unit rate of 1 4 . Look for a graph with a proportional relationship that has a unit rate of 4.
D.
Correct!
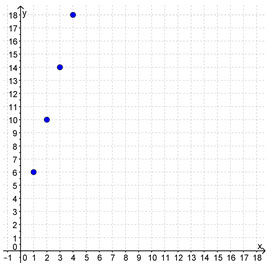
The graph below shows the number of pencils in each of four boxes.
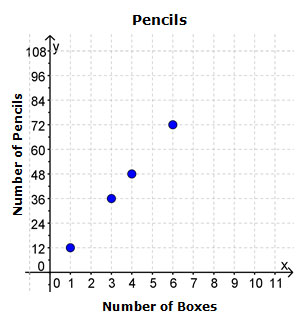
What is the slope of the line that best models the data shown?
A. 1
Incorrect. Each gridline on the y-axis does not represent 1 pencil. Use the numbers on the axis labels to determine the unit rate from the points in this proportional situation. The slope of the line is the same as the unit rate.
B. 12
Correct!
C. 1 12
Incorrect. The slope of a line is the ratio of the vertical distance to the horizontal distance. This number is the ratio of the horizontal distance to the vertical distance.
D. 1 4
Incorrect. Use the numbers on the axis labels to determine the unit rate from the points in this proportional situation. The slope of the line is the same as the unit rate.