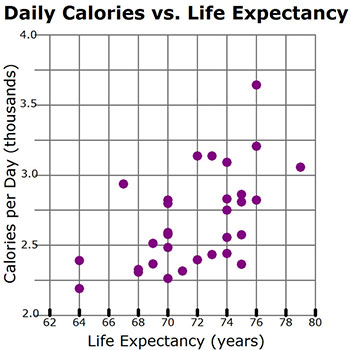
The graph shows the relationship between the life expectancy, in years, and the number of calories per day that the average person consumes, in each of North American and South American countries.
Based on the scatterplot, what type of trend best describes the relationship between the number of calories consumed per day and the average life expectancy?
A. Positive trend
Incorrect. As you read the graph from left to right, how does the number of calories consumed per day change?
B. Negative trend
Incorrect. As you read the graph from left to right, how does the number of calories consumed per day change?
C. No trend
Correct!
D. Cannot be determined
Incorrect. As you read the graph from left to right, how does the number of calories consumed per day change?
Bertram made a scatterplot of the number of CDs sold in the United States since 1983.
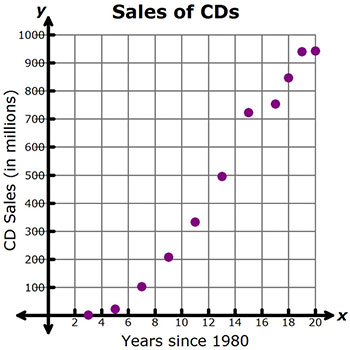
Which statement best describes the relationship shown in the scatterplot?
A. As the number of years since 1980 has increased, the number of CDs sold has increased.
Correct!
B. As the number of years since 1980 has increased, the number of CDs sold has decreased.
Incorrect. As you read the graph from left to right, how does the number of CDs sold change?
C. As the number of years since 1980 has increased, the number of CDs sold has remained constant.
Incorrect. As you read the graph from left to right, how does the number of CDs sold change?
D. As the number of years since 1980 has decreased, the number of CDs sold has increased.
Incorrect. As you read the graph from left to right, how does the number of CDs sold change?
Mrs. Saddiqi is the principal at a local middle school. She wants to know the best price to charge for a can of soda, so she collected the data in the scatterplot.
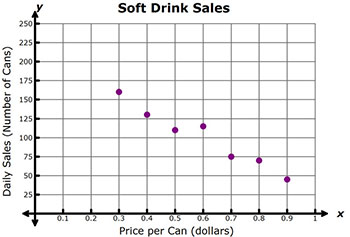
Which statement best describes the relationship shown in the scatterplot?
A. As the price per can increases, the number of cans sold increases.
Incorrect. As you read the graph from left to right, how does the number of cans sold per day change?
B. As the price per can increases, the number of cans sold remains constant.
Incorrect. As you read the graph from left to right, how does the number of cans sold per day change?
C. As the price per can decreases, the number of cans sold decreases.
Incorrect. As you read the graph from left to right, how does the number of cans sold per day change?
D. As the price per can increases, the number of cans sold decreases.
Correct!
For a research project, Dimitri made a scatterplot of leading professional football quarterback’s passing statistics. He graphed the number of interceptions thrown versus the number of touchdown passes thrown.
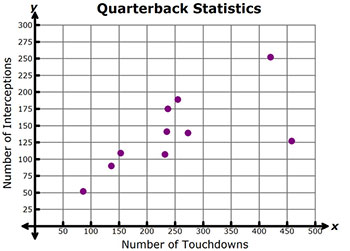
Which statement best describes the relationship shown in the scatterplot?
A. There is no relationship between the number of touchdown passes thrown and the number of interceptions.
Incorrect. As you read the graph from left to right, how does the number of interceptions change?
B. The greater the number of touchdown passes thrown, the fewer the number of interceptions.
Incorrect. As you read the graph from left to right, how does the number of interceptions change?
C. The greater the number of touchdown passes thrown, the greater the number of interceptions.
Correct!
D. The number of interceptions remains constant as the number of touchdown passes increases.
Incorrect. As you read the graph from left to right, how does the number of interceptions change?
Veronica participates in a study group for her science class. She recorded the amount of time that different classmates spent studying for a major test and the grades that those students earned on the test. Her results are shown in the scatterplot.
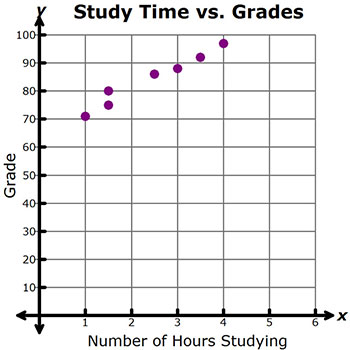
Based on the scatterplot, what type of trend best describes the relationship between the grade and the amount of time spent studying?
A. Positive trend
Correct!
B. Negative trend
Incorrect. As you read the graph from left to right, how does the grade change?
C. No trend
Incorrect. As you read the graph from left to right, how does the grade change?
D. Cannot be determined
Incorrect. As you read the graph from left to right, how does the grade change?