Now that you have had an introduction to topographic maps, here are some rules and tips on how to read them.
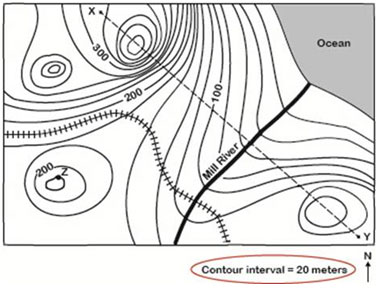
Rule #1- Contour lines never cross. All points along a contour line represent a single elevation. The most striking features of a topographic map are the contour lines. The contour lines connect points of the same elevation. In the map below, the contour interval is 20 meters. That means that between each contour line there is a difference of 20 meters in elevation. If you look closely at the map to your right, you will notice some dark lines with numbers on them. These lines are called index contour lines.
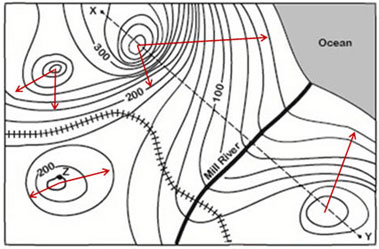
Rule # 2- Contour lines form closed circles around the tops of hills and mountains. Notice that the contours seem to form rings. Inner rings are at higher elevations than outer rings. The innermost rings are the tops of hills. If you start out walking from the innermost ring, you will be walking downhill. The lowest elevation on this map is at the ocean. The red arrows on the map to your right are all pointing from higher to lower elevations.
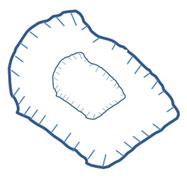
Rule # 3- Contour lines form closed circles marked with short, straight lines (hachure marks) inside the circle around depressions. If there is a low place such as a sinkhole, a crater, or another enclosed area of low elevation, it is called a depression. The hachure marks point downslope toward the center of the depression. The image to the right shows how a depression would be represented on a map.
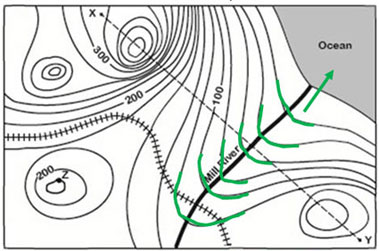
Rule # 4- Contour lines that cross a valley or stream are V-shaped. Contour lines "point" upstream when they cross a river or stream. Look at the Mill River in the map to the right. The V points toward the area of higher elevation. Notice how the contour lines bend uphill where the river crosses them. Knowing this helps you determine which way is uphill and which is downhill. The arrow below points to the direction the water flows, which is always downhill. If you need help remembering, think of it this way: the contours at a stream or river are in a "V" or "U" shape. The water flows out of the opening of the V or U shape and the closed end points uphill.
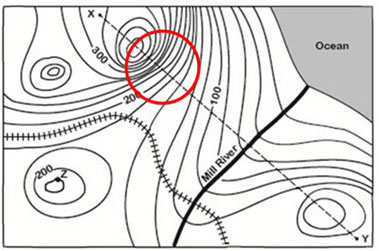
Rule # 5- The spacing of contour lines depends on slope characteristics. Closely spaced contour lines represent a steep slope. Widely spaced lines represent a gentle slope. The circled area on the map to the right indicates the steepest slope on the map where the contours are closest together.
The figure to the right shows how and why those close contours indicate a steep slope. Look at the orange line stretching from X to Y in the map below. The graph on the map shows the profile (what the landscape looks like from the side). Along the left side of the graph are the elevations from sea level (0 meters) to 400 meters. Each of the vertical lines is drawn from the site where our X-Y path crosses each contour line. (Notice that some of the vertical lines are closer together than others. The distance between each vertical line is representative of the horizontal distance between each of the elevations in reality on the ground.)
On the graph below, the vertical line stops at the elevation that matches the point on the map. Place your mouse on the graph and you will see the green line. That green line is what the profile of the landscape looks like.
