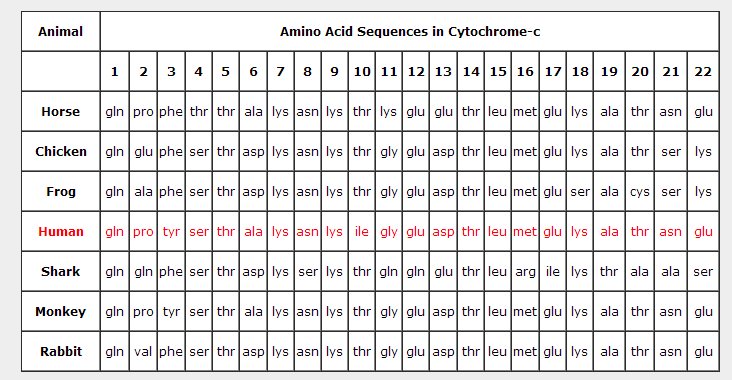
Scientists also use DNA and amino acid sequencing to create cladograms. The chart below shows the amino acid sequence for the protein cytochrome-c in seven vertebrates.

The data table below shows the number of differences.
Number of Amino Acid Differences from Human Cytochrome-c |
|
Species |
Number Differences |
Human |
0 |
Horse |
5 |
Chicken |
6 |
Frog |
8 |
Shark |
13 |
Monkey |
1 |
Rabbit |
4 |
![]() Create a cladogram based on amino acid differences by dragging the picture below to the correct location.
Create a cladogram based on amino acid differences by dragging the picture below to the correct location.