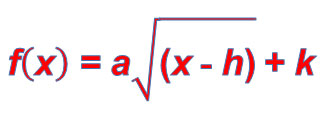
In the previous section, you noticed changes to the graph of the rational parent function by changing the parameters a, h, and k. You noticed that changes in a caused a vertical stretch or compression, changes in h caused a horizontal shift, and changes in k caused a vertical shift. The same holds true for square root functions in the following form:

![]() Four functions, four graphs, and four descriptions of transformations of the square root parent function are listed below. Some functions have already been placed in the table. Place the remaining objects next to their corresponding counter parts.
Four functions, four graphs, and four descriptions of transformations of the square root parent function are listed below. Some functions have already been placed in the table. Place the remaining objects next to their corresponding counter parts.
Interactive popup. Assistance may be required.
As the value of a increases, the graph is vertically stretched. As the value of a gets closer to zero, the graph is reflected horizontally. When the value of a is negative, the graph is reflected across its horizontal asymptote.
Interactive popup. Assistance may be required.
As the value of h increases, the function shifts to the right. As the value of h decreases, the function shifts to the left.
Interactive popup. Assistance may be required.
As the value of k increases, the function shifts up. As the value of k decreases, the function shifts down.
Think about the square root functions, f(x) = √(x + 1) – 2 and f(x) = √(x – 4) – 5. How would you describe the vertical shift from the first function to the second function?
Interactive popup. Assistance may be required.
The second function is translated down 3 units from the first function.
Now think about the rational functions, f(x) = 1 over x + 1 1 (x + 1) – 2 and f(x) = 1 over x - 4 1 (x – 4) – 5. Would the vertical shift between this pair of functions be the same or different as the vertical shift between the square root functions? Explain your answer.
Interactive popup. Assistance may be required.
The vertical shift from the first function to the second function is the same. The vertical shift on a function is the result of the constant being added or subtracted regardless of the parent function.
Interactive popup. Assistance may be required.
Recall the answer to the conclusion question #1 above.
Interactive popup. Assistance may be required.
The graph of the parent function will be compressed by a factor of 1 over 2 1 2 and reflected across the x-axis.
|
|
||||||||||||||||||||||||||||
Interactive popup. Assistance may be required.
Find the difference between the y-values of Function 1 and Function 2.
Interactive popup. Assistance may be required.
Think about which part of the function is affected by a horizontal shift and which part is affected by a vertical shift. Refer back to the conclusion questions for additional help.
Interactive popup. Assistance may be required.
g(x) = √(x + 3)

Interactive popup. Assistance may be required.
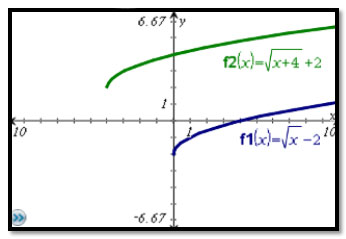
Locate the starting point on the graph of f1(x) and count the units to the left and up to the starting point on the graph of f2(x).
Interactive popup. Assistance may be required.
The graph of function f2(x) has been translated 4 units to the left and 4 units up from the graph of function f1(x).