
You can also graph the linear equations or inequalities on your graphing calculator to find solutions.
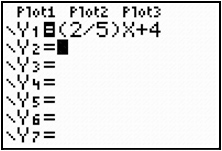
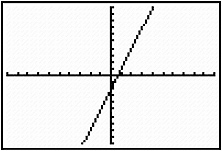
Let's say that you are asked to determine if (8, -2) is a solution to y = two-fifths 2 5 x + 4.
Step 1:
Enter the equation in
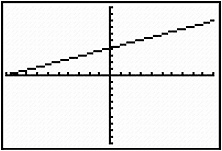
Step 2:
Look at the graph for this equation by pressing  (You may need to set your window.)
Step 3:
Use the  feature by pressing and then typing 8 and pressing
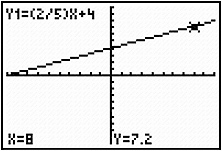
It's easy to see that when x = 8, y = 7.2 and so (8, -2) is NOT a solution to the equation since the point is not on the graph.
Let's look at a linear inequality next.
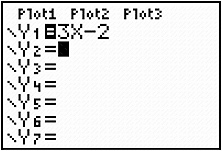
Is (-1, -6) a solution for y ≤ 3x − 2?
Step 1:
Enter the equation in
Step 2:
Look at the graph for this equation by pressing (You may need to set your window.)
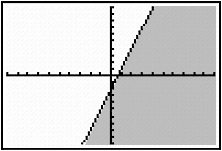
Remember that we are looking for points where y is less than or equal to. So we are looking for points that not only include the points on the line but are also below the line.
The solutions for y ≤ 3x − 2 are located on the line itself and the shaded portion of the graph.
Is (-1, -6) in this shaded region? YES, so it is a solution.
Use the Graph feature on your calculator and determine if the given ordered pair is a solution to each linear equation or inequality.
When you are finished, click below to check your answer.
Interactive popup. Assistance may be required.Answer to question 1: Yes
Answer to question 2: Yes
Answer to question 3: Yes
