Analyzing Arguments on Water Use in the Southwest
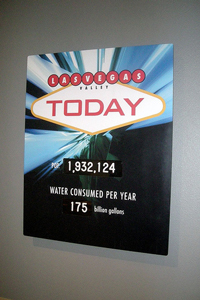
Source: Las Vegas Water Consumption, heidigoseek, Flickr
The excerpt below and the graphic organizer (which you will open later) deal with the current issue of water use in the Southwest. Read each piece carefully, and answer the questions that follow.
To prepare for reading about this topic, watch an animation of how water resources have dwindled in Elephant Butte, a reservoir in New Mexico.
Source: DBS&A’s 3D Animation Displaying Decreasing Water Levels at Elephant Butte Reservoir, Daniel B. Stephens & Associates, Inc. (DBS&A), YouTube
Southwestern Water: Going, Going, Gone?
By Felicity Barringer
Stockholm Environment Institute
The glum projections of the growing gap between demand for water in the Southwest and the dwindling supplies have never been optimistic, but two new studies—one a research report based on satellite data, and the other an analysis of rainfall, water use and the costs associated with obtaining new water—make earlier forecasts seem positively rosy.
Source: 20130618-RD-LSC-0163, USDAgov, Flickr
An acre-foot is generally counted as the amount of water needed to supply two to four average households for a year. The total annual volume from the Colorado River is estimated at 15 million acre feet.
The replacement cost of the water, according to the authors of the analysis, Frank Ackerman and Elizabeth A. Stanton, would be $2.3 trillion to $4 trillion over the next century; by 2050 the annual costs would be $7 billion to $15 billion in 2009 dollars, the equivalent of 0.3 to 0.6 percent of the Southwest’s 2009 gross domestic product.
“Action will be essential,” the authors add. “The bottom-line question about water is not whether adaptation is difficult or expensive, compared to doing nothing,” the authors wrote. “Rather, it should be compared to to buying several trillion dollars worth of water over the next century; adaptation is a bargain that the region cannot afford to ignore.”
A good portion of their report focuses on the drawdown of groundwater reservoirs in California’s San Joaquin Valley, one of the nation’s richest agricultural areas, which depends on water from the Colorado River in the southern part of the state and water pumped southward from the Sacramento and other rivers in the north.
Among Southwestern states, California ranks just after Arizona in the percentage of water use supplied by groundwater: in 2005, it was 33 percent for California and 49 percent for Arizona. In both states, irrigated agriculture accounts for the lion’s share of all water use. The drawdown of underground aquifers has been hard to measure in California because of the state’s decades-old policy of not requiring permits for wells or asking for an accounting of the water withdrawn. But satellite data is filling in some of the gaps.
A study just accepted by the journal Geophysical Research letters, written by Jay S. Famiglietti of the Center for Hydrologic Modeling at the University of California, Irvine, along with eight other authors, uses 78 months of satellite data from NASA’s Gravity Recovery and Climate Experiment satellites, known as the Grace mission.
As Dr. Famiglietti explained in an e-mail:
The Grace mission accurately monitors the very small changes in Earth’s gravity field that result from changes in water stored on land, in the oceans and the ice sheets. So, for example, on land, we can use the gravity data to tell us how much water has entered or left a region like the Sacramento and San Joaquin River basins during a month. We can then use other observations of the snowpack in the Sierras and of the volume of water in local reservoirs to estimate how much of what Grace sees comes from groundwater depletion in the Central Valley.
Using 78 months’ worth of Grace data, his team found that the total loss of groundwater from the Sacramento and San Joaquin River basins in California’s Central Valley from 2003 to 2010 was just under 16.5 million acre-feet—approximately the volume of the Lower Colorado River reservoir, Lake Mead, when it is full. About 80 percent of that loss, the study estimated, came from the San Joaquin basin. A multiyear drought began in the region in 2006.
“Given the naturally low rates of groundwater recharge in the San Joaquin Valley, combined with projections of decreasing snowpack and population growth, continued depletion of groundwater at the rates estimated in this study may become the norm in decades to come, and may well be unsustainable on those time scales,” Dr. Famiglietti and his co-authors write.
Both studies agree on that unappetizing prediction.
Let’s do the first excerpt together so that you’re all set to fill out the graphic organizer in the next exercise. Read the questions below and answer them using your notes. When you’re finished, check your understanding to see a possible response.
- Give several examples of evidence used in the excerpt. Remember, evidence can be statistics, charts, graphs, photographs, expert testimony, government documents, Web sites,
- Who are two of the experts referred to in the article?
- When was the article published?
- Are there any examples of loaded words in the article?
- Do you think this article is a credible resource? Why?
- Do the two studies agree in their conclusions?
Sample Responses:
The United States branch of the Stockholm Environment Institute, based in Somerville, Mass., released an extended analysis of water demand and future supplies that estimates that the cumulative shortfall over the next century in the Southwest, without adaptation strategies, will be 1.815 billion acre feet.
Among Southwestern states, California ranks just after Arizona in the percentage of water use supplied by groundwater: In 2005, it was 33 percent for California and 49 percent for Arizona. In both states, irrigated agriculture accounts for the lion’s share of all water use.
Using 78 months’ worth of Grace data, his team found that the total loss of groundwater from the Sacramento and San Joaquin River basins in California’s Central Valley from 2003 to 2010 was just under 16.5 million acre-feet — approximately the volume of the Lower Colorado River reservoir, Lake Mead, when it is full. About 80 percent of that loss, the study estimated, came from the San Joaquin basin.
CloseSample Responses:
Frank Ackerman and Elizabeth Stanton of the Stockholm Inst. and Dr. Jay Famiglietti of NASA’s Gravity Recovery and Climate Experiment
CloseSample Responses:
February 11, 2011
CloseSample Responses:
There is very little use of loaded language. The words “glum,” “rosy” and “unappetizing” are the only examples of words that have emotional connections to them.
CloseSample Responses:
Yes, because the sources are written by people connected to well-respected institutions that measure water use and drought in these areas.
CloseSample Responses:
Both studies reach the conclusion differently but agree that the Southwest will use more water than it has on hand.
Close
For the next exercise, open the graphic organizer. The graphic organizer contains two more excerpts about conserving water in the Southwest. Follow the instructions provided. You can type your answers into the graphic organizer or download it, print it, and hand write your answers. Return to the lesson when you are finished. Graphic Organizer Instructions