
Source: Us with family, E. A. Sanabria, Flickr
A bar graph shows us how one member of a “family” compares to other members of a family. We aren’t just talking about mothers and brothers and uncles. In this case, we are using “family” to mean any group of related items (people, places, scores, costs). Look at the items below and click on the ones you think could be considered families. To see if you are correct, check your understanding below.

All of these choices could be members of a “family.”
Any set of items can, for the purposes of a bar graph, be considered a family. We also refer to these family members as the categories.
A bar graph considers how these family members compare with each other in relation to one attribute. For instance, if the “family” is a group of people, we can compare them by age. We can refer to this attribute of comparison (their ages) as the value.
You could make a bar graph of the members of your family by age, including aunts and uncles, if you wish. The oldest person would have the tallest bar on the graph. The bar would start at zero-years-old and rise vertically until it reached the person’s age. The youngest person would have a much shorter bar on the graph going from zero to this youngest person’s age.
Let’s think of another family: the set of teachers one student has in the ninth grade.
Imagine that you want to represent the ages of these teachers. You could, of course, just list them.
Mr. Parker is 45.
Ms. Prell is 42.
Ms. Snifley is 48.
Ms. Ryan is 58.
Mr. Halverson is 29.
There are, however, some advantages in presenting this data graphically. Look at the graph below. What data does the graph make clearer and easier to understand? As you answer the questions following the graph, think about whether it’s easier to use the graph or the list to figure out the answers.
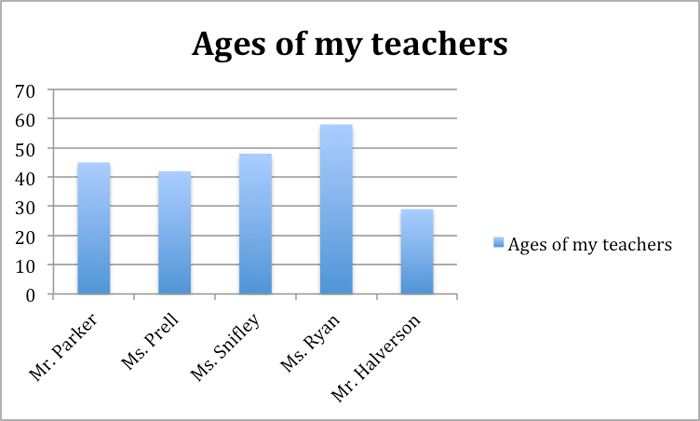
Source: Teacher_age_chart, IPSI
You should be able to answer the questions below using either the graph or the list, but again, consider which is easier.
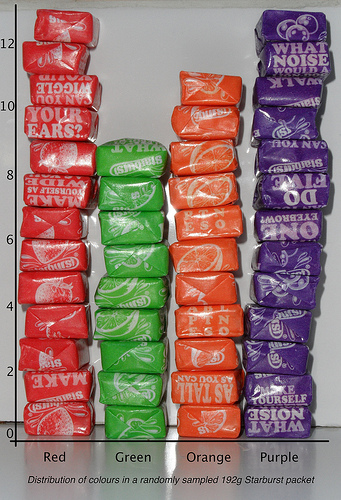
Source: distribution of colors in a randomly sampled 192g Starburst packet, sermoa, Flickr
Was it easier to answer these questions by reading the graph or reading the list? You might be an exception, but for most people, the graph makes it easier to answer the questions. That’s why writers use graphs to present data like this. Graphs are easier and clearer to read and usually present the information in a more dramatic way.
The advantage of a bar graph is in representing significant differences dramatically. What about a line graph? What can a line graph do better than a list?