
Source: Jogging, Iguanasan, Flickr
Why do we need graphs? Why not just explain something in words without trying to represent it in a graph? Most authors of informational texts use graphs in addition to words when discussing factual, quantitative, and technical data because the graphs make it easier for readers to understand complex or technical information. Think about the difference between a list of directions and a map.
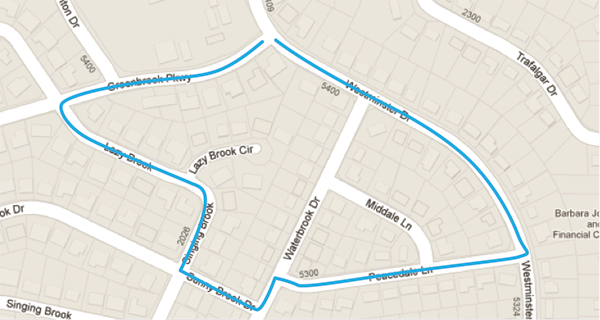
Some directions for a jogging route through a neighborhood of Austin, Texas, appear below.
Start at Greenbrook and Westminster. Go SW on Greenbrook to Lazy Brook. Turn left on Lazy Brook and follow it around a curve (where it turns into Singing Brook). Turn left on Sunny Brook, and then turn left again on Waterbrook Drive. Turn right onto Peacedale Lane and go past Middale Lane to Westminster. Turn left on Westminster and follow it back to the start.
Now, reread the directions and imagine what shape this running course would be. Which of the shapes below comes closest to the shape you would run if you followed these directions? Click on the box next to the one you think is closest.


For some people, these directions will work fine, but for other people, the directions will be impossible to make sense of without seeing them on a map. The map illustrates for us what the twists and turns mean in relation to each other and in relation to the whole area of the neighborhood.
Source: Jogging, Iguanasan, Flickr
You may recall the following from seeing graphs in texts you have read:
- A graph does the same thing a map does: It illustrates relationships for us.
- A bar graph illustrates members of a family of information in relation to each other.
- A line graph illustrates a story of a type of information in relation to time.
- A pie chart or circle graph illustrates a whole system being divided into parts.
You will look at each of these types of graphs as you work your way through the lesson.