Creating Your Own Graphic Representations
The last exercise you will do in this section is to construct your own bar graph and a circle graph to show data from a chart. Look through the sections and activities that you have completed to help you with this exercise.
Source: Student Tours, dominguezmuseum, Flickr
| Students’ favorite after school activities | |
|---|---|
| Activity | Percentage of Students |
| Play sports | 12 |
| Spend time with family | 18 |
| Spend time with friends | 22 |
| Work at a job | 14 |
| Chat online/via text message | 18 |
| School clubs or organizations | 9 |
| Watch TV or movies | 7 |
In your notes, create a circle graph using the data set above. When you are finished, answer the questions below.
- What does your new circle graph tell us?
- What does your new bar graph tell us?
 Write your answers using your notes. Check your understanding when you are finished to see a possible response.
 Sample Response:
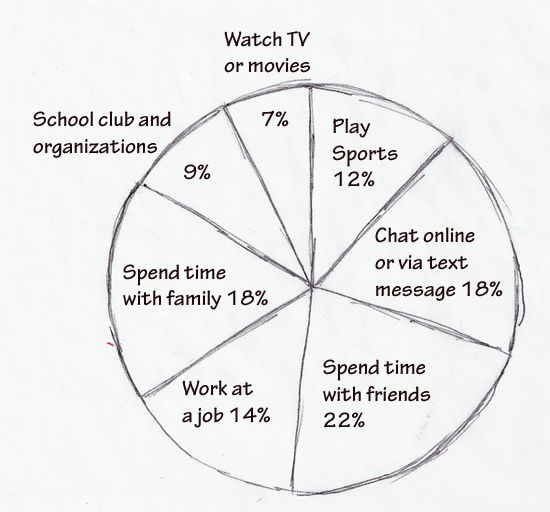
This circle graph shows that a majority of students prefer to spend time with their friends after school. The least favorite activity is watching television. Spending time with friends combined with spending time with family represents almost half of the activities. For both spending time with friends and chatting online or via text messages, it looks like the same percentage might apply.
Now create a bar graph using the information in the data set above. Again, create the graph using your notes. When you are finished, answer the question below.
Write your answers using your notes. Check your understanding when you are finished to see a possible response. Sample Response:
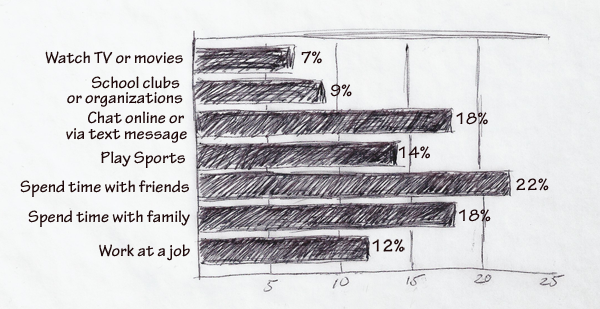 This bar graph illustrates that spending time with family and chatting online are roughly equal in popularity, while watching TV is the least favorite and is represented by the smallest bar. The most popular activity, spending time with friends, is represented by the largest bar. It is three times larger than the smallest bar, which is watching TV.