Transforming Data from Words to Graphic Representations in Charts
A chart is a graphic representation that makes a comparison or shows a process. Charts usually represent information in columns and rows. This example shows household chores for the week.
| Chores | Monday | Tuesday | Wednesday | Thursday | Friday | Saturday | Sunday |
|---|---|---|---|---|---|---|---|
| Take Out Trash | X | X | X | ||||
| Feed/Walk Dog | X | X | X | X | X | X | X |
| Clean Room | X | X | |||||
| Mow Yard | X |
According to this chart, the trash is taken out three times a week (on Monday, Wednesday, and Friday), the dog is fed and walked every day, the bedroom is cleaned twice a week (on Wednesday and Sunday), and the yard is mowed once a week (on Saturday).
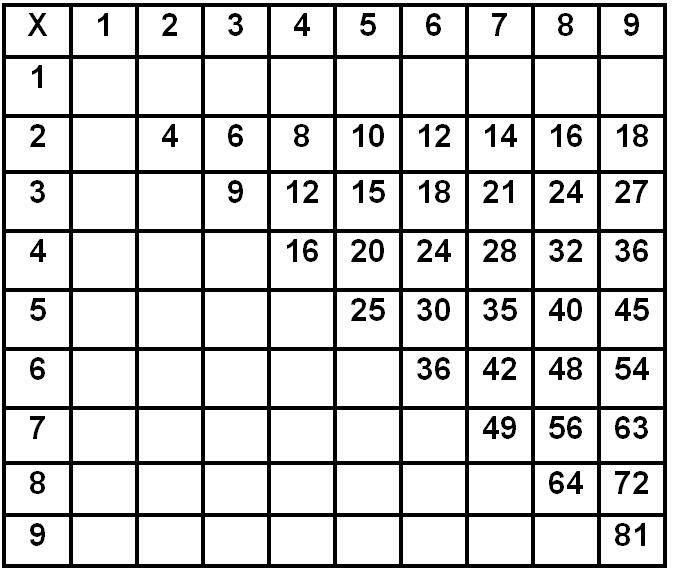
Source: Memorization Multiplication table, Wikimedia
Another form of chart is called a table. A table is a type of chart that shows a set of facts in columns and rows and shows how the various pieces of data are related to each other. The table on the left is an example of a table you should be familiar with; it is a multiplication table.
This table graphically represents the answer to every basic multiplication problem for numbers below ten. The column for “1” is left blank because those answers are obvious (a number multiplied by one equals itself). This type of table is common in mathematics and science.
Here is another example of a chart that you are certain to encounter as a student. It is pretty complex but does a great job of organizing a lot of data. This is the periodic table of elements, a chart that you will inevitably see in your science classes.
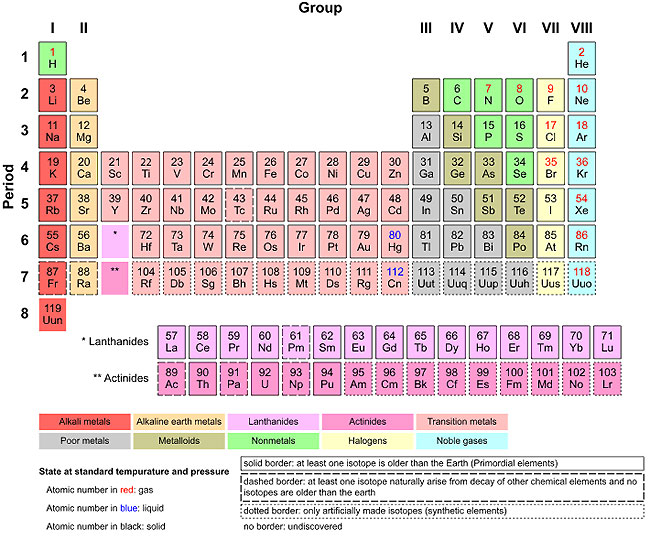
Source: Periodic Table of Elements, Wikimedia
The periodic table is a chart of the chemical elements arranged by order of atomic number in such a way that the periodic properties of the elements are shown. The standard form of the table, depicted here, is very useful. It includes periods (running horizontally) and groups (running vertically). Elements in groups have some similar properties to each other.