 Source: World Population Distribution Map, eHow
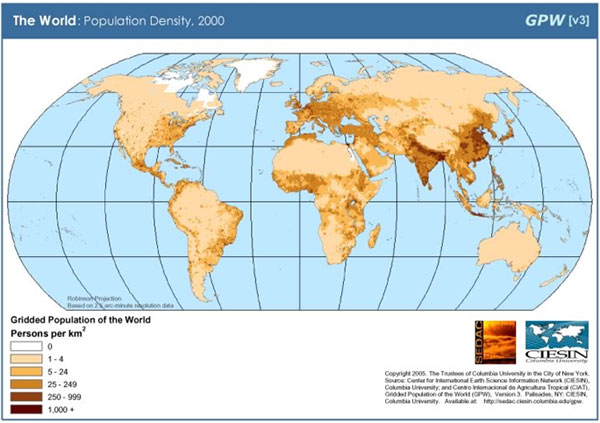
 Population density refers to measurement of the number of people in a given area. Population density is calculated by dividing the number of people by area. Population density is usually shown as the number of people per square mile or square kilometer. The map below illustrates population density. (Helpful hint: The darker the color, the greater the population density.)
World Population Density
 Source: World Population Distribution Map, eHow
 The map above shows that world population distribution is uneven. Some areas have a high population density (many people living within a particular area) while others have a low population density (fewer people live within a particular area). Areas of high population density tend to be located between 20° and 60°N. This area contains a large land area and a relatively temperate climate, making it easier for people to live. On the map, the areas of high population density are represented by the dark areas.
The areas with low population density are sometimes areas with uninhabitable climates or undeveloped (uninhabitable) land; these factors make it difficult for people to live in these areas. The lighter shaded areas on the map represent the areas of low population density.
World Density Map
 Source: World Density Map, Map Sharing
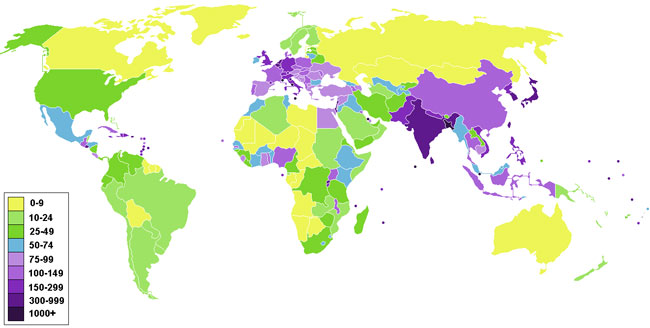
 It is helpful to compare various types of world density maps. The map above uses various colors to illustrate the differences. Again the lighter colors, the yellows, illustrate low density while the darker colors, the deep purples represent the more densely populated areas.
Analyze the World Density Map above, which two continents have a majority of nations that are densely populated? Interactive popup. Assistance may be required.
Europe and Asia
Understanding Population Density
![]() Activity: Match the term or statement on the left and drag it to the term or statement that completes it on the right.
Activity: Match the term or statement on the left and drag it to the term or statement that completes it on the right.