
You Try!
Time (Days) |
Plant Height (cm) |
1 |
0 |
2 |
2 |
3 |
4 |
4 |
6 |
5 |
8 |
6 |
10 |
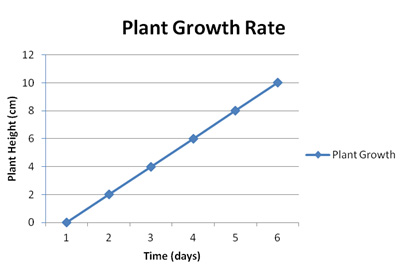
A student was studying the use of fertilizers to promote plant growth in the laboratory. This graph shows her data on one plant. Analyze the data provided in the graph to answer the following questions.
What was the height of the plant at day 5?
Using the data provided in the graph, what would you predict the plant height to be on day 7?
Using the data provided in the graph, what would you predict the plant height to be on day 12?