In the last section, you calculated the mean of a data set. In this section, you will use the mean to calculate the mean absolute deviation of a set of data.
Mean absolute deviation is the mean of the absolute values of the deviations, or differences, between each number in the data set and the mean of the data set.
Mean is a useful measure for identifying a "typical" value in a data set, but sometimes, you also need to know how far the data set is spread out.
Consider the data table below, which shows the charge times, in hours, of two different computer batteries.
| Battery A | 2 | 3 | 3.5 | 3 | 4 | 5 | 6.5 | 7 | 8 | 8 |
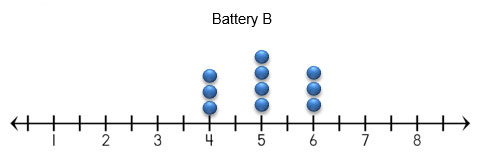
| Battery B | 4 | 4 | 4 | 5 | 5 | 5 | 5 | 6 | 6 | 6 |
Interactive popup. Assistance may be required.
Battery A: 5 hours
 Construct a dot plot for each of the batteries. To do so, click and drag the point from the number onto the number line.
Interactive popup. Assistance may be required.
The data values for Battery A are more spread out, and the data values for Battery B are more closely clustered.
Interactive popup. Assistance may be required.
The mean of the data values for both batteries was five hours. However, the data values for Battery A are spread out farther from the mean, and the data values for Battery B are closer to the mean.
You can use mean absolute deviation to determine exactly how spread out a set of data is from the mean.
Click on the Begin button to begin the animation below to see how Marley calculated the mean absolute deviation for Battery A.
Battery B |
4 |
4 |
4 |
5 |
5 |
5 |
5 |
6 |
6 |
6 |
The absolute deviations from the mean, 5, for Battery B are shown in the table.
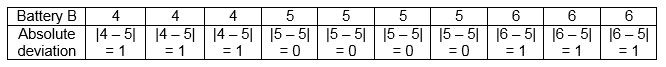
The mean absolute deviation is (1 + 1 + 1 + 0 + 0 + 0 + 0 + 1 + 1 + 1) ÷ 10 = (6) ÷ 10 = 0.6.
How does the mean absolute deviation for Battery A and Battery B compare to what you observed in the dot plots for Battery A and Battery B?
How does mean absolute deviation describe the spread of a data set from the mean of the data set?
Interactive popup. Assistance may be required.
To calculate the mean absolute deviation, first calculate the mean of the data set. Then, subtract each data value from the mean, and take the absolute value of the difference. These are the absolute deviations of each number in the data set. Finally, calculate the mean of the absolute deviations.
Baseball Team Salaries (millions of dollars) |
|
Top Five Salaries |
Bottom Five Salaries |
33.00 24.35 22.80 20.33 16.45 |
0.47 0.45 0.43 0.44 0.41 |
What is the approximate mean absolute deviation of the top five salaries for this baseball team?
City |
Average January Low Temperature (°C) |
Amarillo |
-5 |
Laredo |
8 |
Houston |
6 |
El Paso |
0 |
Texarkana |
1 |
San Antonio |
5 |
What is the approximate mean absolute deviation of the average low temperatures for this set of Texas cities for the month of January?