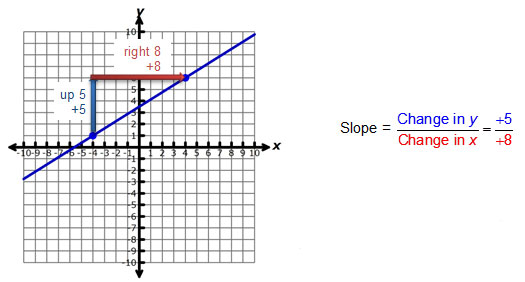
In the previous section, you learned the definition of slope to be as follows:
Rate of Change = change in y over change in x Change in y Change in x = slope
Graphically, the slope of a line can be represented using a change in the vertical direction and a change in the horizontal direction.

Given two points (x1, y1) and (x2, y2), the slope of a line can be determined using the formula below.
Slope of a line = m =
y2 – y1
x2 – x1
,
where m represents the slope of the line.
In the slope formula, y2 - y1 represents the change in y, while x2 – x1 represents the change in x. Let’s practice using the slope formula with the interactive below.
Directions: Find the slope of the line connecting the points (-4, 7) and (-3, -1). Simplify the numerator and denominator in order to determine the change in the vertical direction and the change in the horizontal direction.
![]() Drag the numbers into the appropriate place in the formula.
Drag the numbers into the appropriate place in the formula.
Determine the slope of the line connecting the two points given.
Interactive popup. Assistance may be required.
Use the slope formula where the point (3, 5) is (x1, y1), and the point (8, 10) is (x2, y2). Interactive popup. Assistance may be required.
m =
y2 – y1
x2 – x1
=
10 – 5
8 – 3
= 5 over 5
5
5
= 1
Interactive popup. Assistance may be required.
Use the slope formula where the point (-3, 7) is (x1, y1), and the point (5, -2) is (x2, y2). Interactive popup. Assistance may be required.
m =
y2 – y1
x2 – x1
=
-2 – 7
5 – (-3)
= -9 over 8
-9
8
= -9 over 8
-
9
8

Interactive popup. Assistance may be required.
Use the slope formula where the point (2d, 7d) is (x1, y1), and the point (3d, d) is (x2, y2). Be sure to simplify by canceling common factors in the numerator and denominator. Interactive popup. Assistance may be required.

