
Now that we have had some practice representing the values of fractions, we need to look at how their values compare to one another. The following activity will ask you to create images that represent the values of two fractions and then to determine a fraction whose value lies between the two that were given.

![]() Click on the image below to access the activity. You will divide the square into equal-sized pieces and then click to shade the part of the square that is the same as the fraction shown.
Click on the image below to access the activity. You will divide the square into equal-sized pieces and then click to shade the part of the square that is the same as the fraction shown.
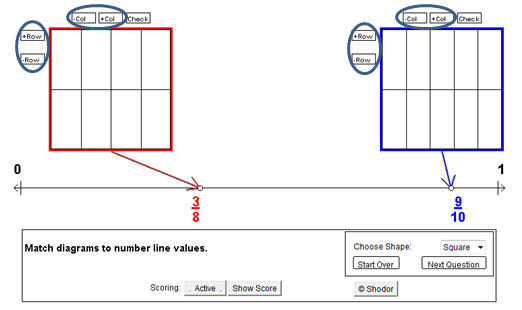
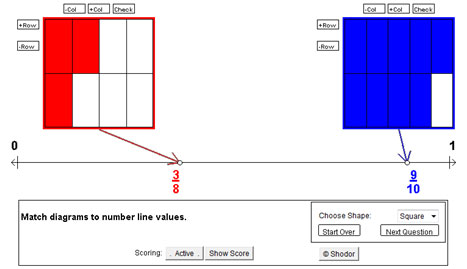
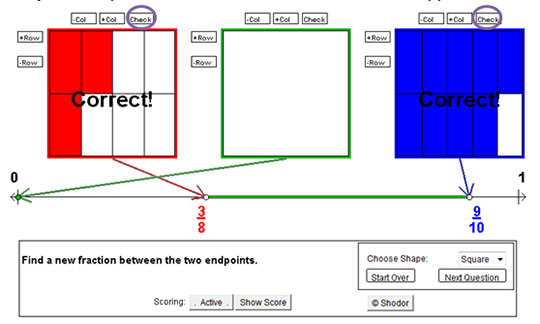
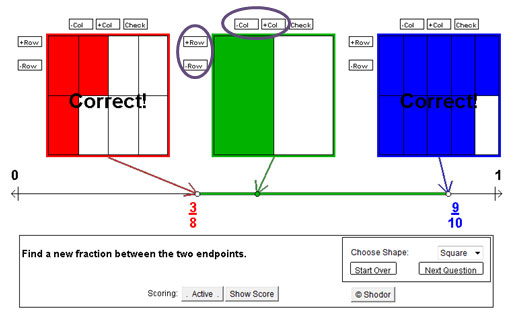
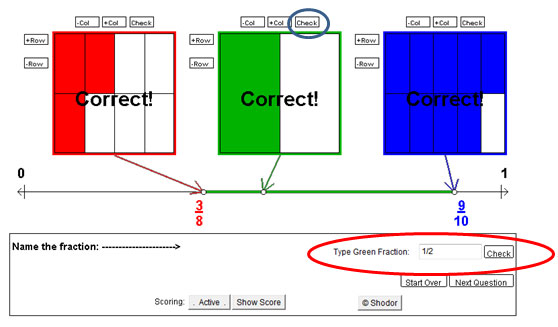
On a piece of paper, fill in the following table:
| Red Fraction | Picture | Blue Fraction | Picture | Green Fraction | Picture |
![]() Based on what you have learned, drag the following fractions to the correct locations on the number line:
Based on what you have learned, drag the following fractions to the correct locations on the number line:
When you are able to make a good sketch of a fraction, you can use this method to compare fractions. Fractions like halves, thirds, fourths, eighths, etc. are relatively easy to model with a picture. This may not always be the case. If the fractions that you are comparing are difficult to model with a drawing, you may want to use a calculator to convert them to decimals and then use the number line like in section 2. To convert a fraction into a decimal, divide the numerator by the denominator.
Use a calculator to complete the following table in your notes.
Fraction |
1
2
|
-
15
8
|
5
7
|
15
6
|
-
5
4
|
-
2
3
|
Decimal |
Fraction |
1
2
|
-
15
8
|
5
7
|
15
6
|
-
5
4
|
-
2
3
|
Decimal |
0.5 |
-1.875 |
0.714 (rounded) |
2.5 |
-1.25 |
-0.667 (rounded) |

![]()