 Use a plotting applet to graph both the line and the points in the table. This tool will allow you to confirm whether or not the points in the table lie on the graph of the line.
A table is an efficient way to organize numerical data. In a previous lesson, you investigated different ways to generate a graph when given a table, and different ways to generate a table when given a graph.
Consider the graph of the equation y = 0.5x – 4 and a table of data.
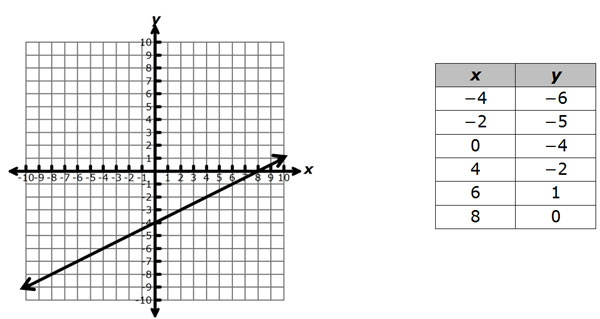
How can we tell if the points contained in the table actually lie on the graph of the line y = 0.5x – 4? One way to do so is to plot the points contained in the table on the graph, and test each point to see if it lies on the line.
Use a plotting applet to graph both the line and the points in the table. This tool will allow you to confirm whether or not the points in the table lie on the graph of the line.
Use the graph and table provided to determine which points lie on the graph of the line.
Interactive popup. Assistance may be required.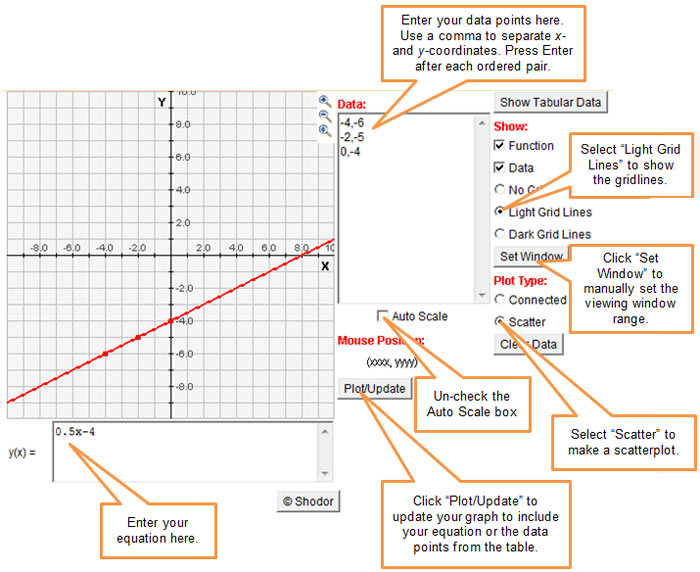


Use the interactive below to identify which points from the table lie on the graph of the line y = 0.5x – 4. For each ordered pair, click on the cell in the Lies on Line column if the point lies on the line, or click on the cell in the Does NOT Lie on Line column if the point does not lie on the line.
Use the graphing applet to determine which of the following tables contain only points that lie on the graph of the line y = One Third 1 3 x + 3.
| Table A | |
|---|---|
| x | y |
| -9 | 0 |
| -3 | 2 |
| 0 | 3 |
| 2 | 3 Two Thirds 2 3 |
| 6 | 5 |
| Table B | |
|---|---|
| x | y |
| -9 | 0 |
| -3 | 3 |
| 0 | 3 |
| 4 | 4 One Third 1 3 |
| 6 | 5 |
| Table C | |
|---|---|
| x | y |
| -9 | 0 |
| -3 | 2 |
| 1 | 3 One Third 1 3 |
| 3 | 4 |
| 9 | 6 |
| Table D | |
|---|---|
| x | y |
| 0 | -9 |
| 2 | -3 |
| 3 One Third 1 3 | 1 |
| 4 | 3 |
| 6 | 9 |