You used tables and graphs to show how to represent situations with a constant rate of change, such as those involving scaling.
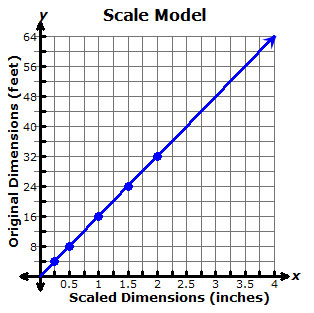
For example, suppose a scale model is built using a scale of 1 over 4 1 4 inch to 4 feet. You can use this scale to build a table of values.
| Scaled Dimensions |
0.25 inch | 0.5 inch | 1 inch | 1.5 inches | 2 inches |
| Original Dimensions |
4 feet | 8 feet | 16 feet | 24 feet | 32 feet |
Once you have a table of values, you can build a graph.
From the graph, you can then identify additional values that match the same scale.