 Use the interactive below to practice plotting ordered pairs of rational numbers. For each of the given points, drag the point to the location indicated by the coordinates next to the point.
Graphing ordered pairs on a coordinate plane is a very important way to visually represent the relationship between the two variables of a data set.
Use the interactive below to practice plotting ordered pairs of rational numbers. For each of the given points, drag the point to the location indicated by the coordinates next to the point.
Use the interactive to answer the following questions.
Interactive popup. Assistance may be required.
The first coordinate is the x-value of the ordered pair, so it corresponds with the distance from the origin along the x-axis.
Interactive popup. Assistance may be required.
The second coordinate is the y-value of the ordered pair, so it corresponds with the distance from the origin along the y-axis.
Interactive popup. Assistance may be required.
If the sign is positive, then the coordinate will be to the right or above the origin. If the sign is negative, then the coordinate will be to the left or below the origin.
Data sets are sometimes presented in tabular form instead of ordered pairs.
x |
4 |
-2.1 |
7.8 |
0 |
y |
1 |
5 |
-3 |
4 |
How would you graph the points represented by the data in the table?
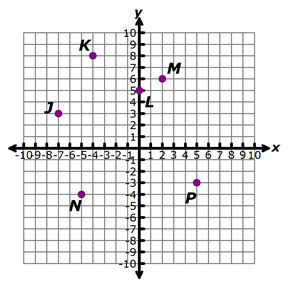
Use the graph below to identify the coordinates of the given points.
Interactive popup. Assistance may be required.
To get to point N from the origin, would you need to go left or right, and then go up or down? How far do you go in each direction?
Interactive popup. Assistance may be required.
To get to point K from the origin, would you need to go left or right, and then go up or down? How far do you go in each direction?
Interactive popup. Assistance may be required.
To get to point L from the origin, would you need to go left or right, and then go up or down? How far do you go in each direction?
Interactive popup. Assistance may be required.
To get to point P from the origin, would you need to go left or right, and then go up or down? How far do you go in each direction?