In this lesson, you used data collected from a random sample to make predictions about a population. You also saw different graphical representations of data and used those representations to determine whether or not given conclusions were valid.

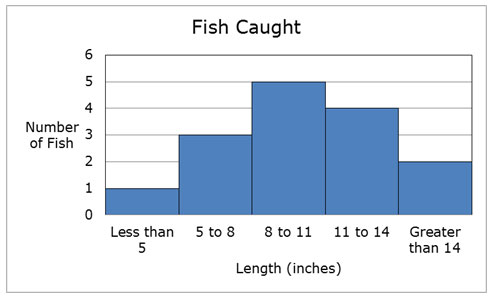
The graph shown below displays data that Brendan and Emily collected from a recent fishing trip. They caught 15 fish and made the graph showing the lengths of the fish that they caught.

![]() When they studied the data, Brendan made several conclusions. Assist Emily in sorting the conclusions into those that are valid and those that are invalid.
When they studied the data, Brendan made several conclusions. Assist Emily in sorting the conclusions into those that are valid and those that are invalid.