Trees and forests are important to the ecology of any town, city, or state. Urban planners need to know about the different trees present in a city to make sure there is enough green space to promote recreation. Foresters need to know about the types of trees in a forest to combat outbreaks of disease and other pests that harm forests.
In this section, you will use sampling techniques in order to describe a neighborhood forest.
Susana wants to know what types of trees and how many of each type are in her neighborhood. Instead of counting every tree in the neighborhood, Susana randomly selected 25 houses out of the 240 in her neighborhood to survey the types of trees.
 Use the interactive below to determine the number of each of the four types of trees that Susana found at the 25 houses. Click on the leaf or tree to see the number of that type of tree that Susana found. Use the information below to complete the table that follows.
Copy and paste the table below into your notes, and use the information in the interactive to complete the table.
Type of Tree |
Number of Trees |
White Oak |
|
Cedar Elm |
|
Loblolly Pine |
|
Pecan |
Type of Tree |
Number of Trees |
White Oak |
30 |
Cedar Elm |
24 |
Loblolly Pine |
42 |
Pecan |
20 |

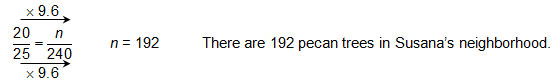
Now that Susana has completed her survey, she is ready to use it to make predictions about the population of trees in her neighborhood.
Susana can set up and solve a proportion relating the ratio of each type of tree in her sample to the ratio of each type of tree in her neighborhood.
 Watch the video below to see how Susana set up and solved a proportion to determine the number of white oak trees in her entire neighborhood.
Use what you have seen so far to answer the following questions.
Interactive popup. Assistance may be required.
Set up and solve a proportion using two ratios of number of pecan trees : number of houses.
Interactive popup. Assistance may be required.
Set up and solve a proportion using two ratios of number of cedar elms : number of houses.
When using a sample to make predictions about a population, why is it important to make sure that the sample is representative of the population?
What is one way you can help to make sure your sample is representative of the population?
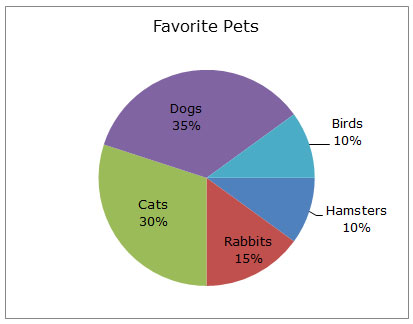
Reginald wanted to know which pet was most popular among seventh graders at his school. He randomly surveyed 60 students during seventh grade lunch. The results of his survey are shown in the graph below. Use this graph to answer questions 1 – 3.
Interactive popup. Assistance may be required.
30% of the students surveyed, or 30% of 60, said that their favorite pet was a cat. Use this information to determine the number of students that 30% of 60 represents.
Interactive popup. Assistance may be required.
35% of the students surveyed said that a dog was their favorite pet. If the sample is representative of the population, then 35% of the population should say that a dog was their favorite pet.
Interactive popup. Assistance may be required.
Use the data to determine how many of the 340 students would favor dogs and how many would favor cats.