In the previous sections, you examined ways to determine the probability of simple events and independent events. In this section, you will use data to make predictions from the probability of one or more events.
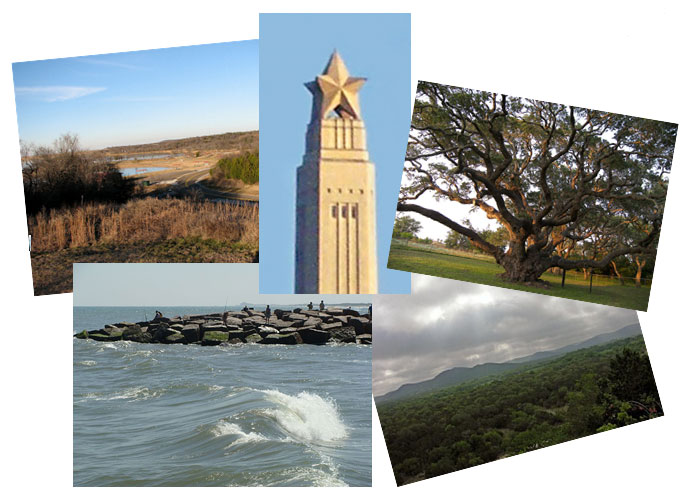
Sources: Cedar Hill State Park, QuesterMark, Flickr
San Jacinto Monument Star, Tijuana Brass, Wikimedia Commons
Big Tree, Larry D. Moore, Wikimedia Commons
Mustang State Park Nima, Zereshk, Wikimedia Commons
Garnerview3, Baylordad, Wikimedia Commons
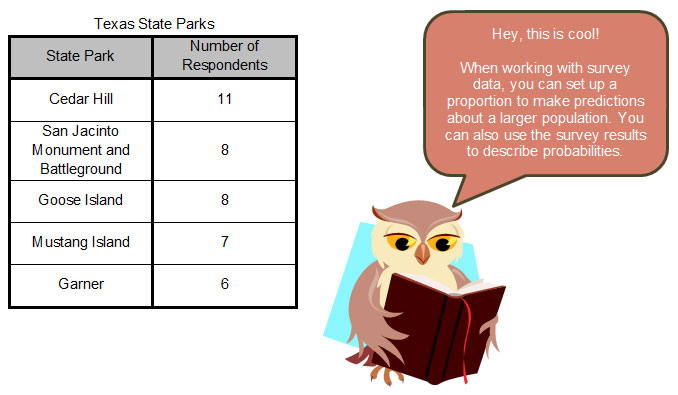
A recent survey of Texas state park users revealed the five most popular state parks. The results are shown in the table below.
Use the data in the table to answer the following questions.
- Based on this data, what is the probability that the next state park user randomly surveyed will say that Garner State Park is their favorite?
Interactive popup. Assistance may be required.
Need a hint?
- Based on this data, what is the probability that the next state park user randomly surveyed will say that either Goose or Mustang Island is their favorite?
Interactive popup. Assistance may be required.
Need a hint?
- Based on the data, what is the probability that the next two state park users randomly surveyed will say that Cedar Hill State Park is their favorite?
Interactive popup. Assistance may be required.
Need a hint?
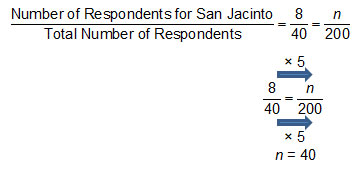
- Anessa decides to survey 200 people to determine which of the five state parks they prefer. Based on the information in the table, how many people should Anessa expect to say that the San Jacinto Monument and Battleground is their favorite state park?
Interactive popup. Assistance may be required.
Need a hint?
Pause and Reflect
How can you use data to determine the probability that an event will occur?
Practice
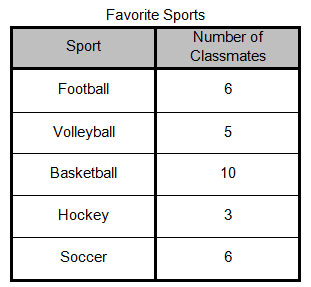
Majida surveyed 30 of her classmates to determine which sport was their favorite. Her results are shown in the table below. Use this information to answer questions 1 – 3.
- Based on this data, if Majida randomly surveyed one more person, what is the probability the person would prefer basketball?
Interactive popup. Assistance may be required.
Need a hint?
- Based on the data, what is the probability that the next two people surveyed would prefer volleyball or basketball?
Interactive popup. Assistance may be required.
Need a hint?
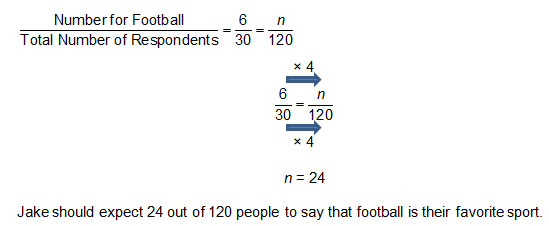
- Jake wants to survey 120 students in the cafeteria to determine their favorite sport. If his results are similar to Majida’s survey results, how many people should he expect to say that football is their favorite sport?
Interactive popup. Assistance may be required.
Need a hint?