A bar graph is used to display and compare categorical data. Categorical data are data that can be divided into groups.
A line graph is used to display and analyze time series data, or data that show how a variable has changed over time.

A circle graph is used to display how different parts of a categorical data set relate to the whole data set. Each sector of the circle graph represents the portion of the data set for that particular category.
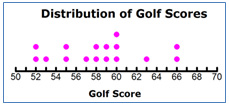
A line plot is used to show the distribution of a numerical data set. A line plot uses a number line and markers, such as dots or X’s, to show how often a particular value occurs in a data set.
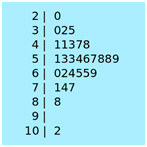
A stem and leaf plot is used to show the distribution of a numerical data set by using place value of hundreds, tens, or ones to make stems, and the ones digits to make leaves. Stem and leaf plots, also called stemplots, became popular in the 1980s as a way to quickly display the distribution of a data set.
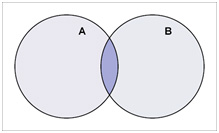
A Venn diagram is used to compare and contrast two different data sets by identifying the characteristics or data elements that each data set has apart from the other, as well as the characteristics or data elements that each data set has in common. The diagram was introduced in the late 1800s by John Venn who was a British philosopher.
Sources of images used in this section, as they appear, top to bottom: