In the previous section, you used verbal descriptions, tables, graphs, and equations to represent an additive relationship between the independent variable and the dependent variable. But not all relationships are additive. In this section, you will investigate another type of relationship, multiplicative relationships. Instead of being related by addition, the variables in these relationships are related by multiplication.
Copy the following table into a word processing or spreadsheet app or program. Use the results from the interactive to complete the table.
Time Driven (hours) |
Distance Driven (miles) |
0 |
0 |
1 |
|
2 |
|
2.5 |
|
3 |
|
3.5 |
|
4.5 |
Time Driven (hours) |
Distance Driven (miles) |
0 |
0 |
1 |
65 |
2 |
130 |
2.5 |
162.5 |
3 |
195 |
3.5 |
227.5 |
4.5 |
292.5 |

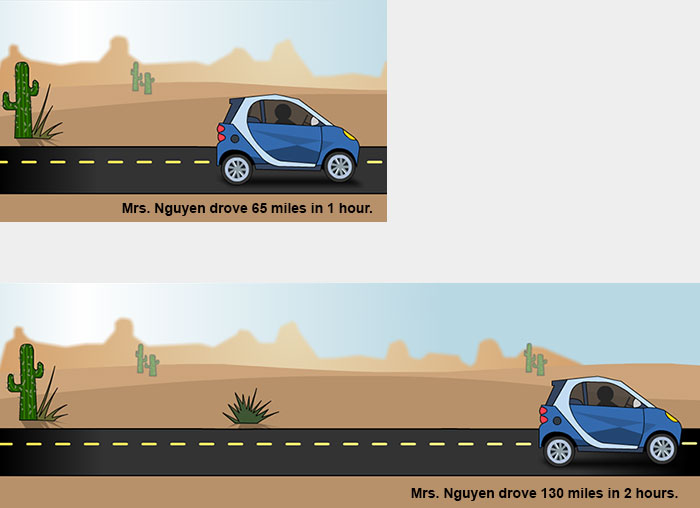
 Use the interactive below to determine the distance that Mrs. Nguyen has driven after a given number of hours. Record the distance (in miles) from the odometer reading and time (in hours) from the stopwatch in a table like the one that follows. The stopwatch shows you hours and minutes. You will need to convert this value to hours (e.g., 1:30 is 1 hour 30 minutes, which is 1.5 hours). Copy the following table into a word processing or spreadsheet app or program, and use the program or app to complete the table. The car will automatically advance to the next position when you click the continue button.
Use your completed table and the interactive to answer the questions that follow.
Interactive popup. Assistance may be required.
The distance driven is 65 times the time driven.
Interactive popup. Assistance may be required.
d= 65t
Use the interactive below to plot the points from the table of values that you just generated. Drag each point from the bank to its correct place on the coordinate grid below.
Use your completed graph to answer the questions that follow.
Interactive popup. Assistance may be required.
y = 65x
Interactive popup. Assistance may be required.
This equation, y = 65x, is the same as d = 65t. In the graph, x represents the same independent variable, the amount of time that Mrs. Nguyen has driven, as the variable t represents in the table of values. In the graph, y represents the same dependent variable, the total distance that Mrs. Nguyen has driven, as the variable d represents in the table of values.
So far, you have used verbal descriptions, tables, graphs, and equations to represent a multiplicative relationship. Now, take a closer look at how the relationships are related.
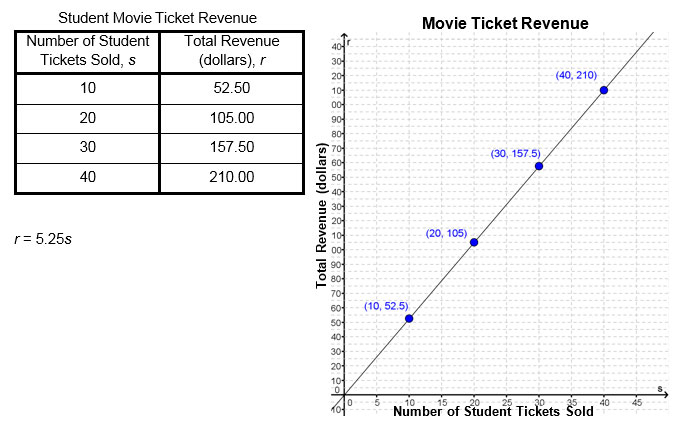
Click on each representation to see how the independent variable, dependent variable, and constant multiplier, or factor, appear in that representation.
How does the constant multiplier, k, appear in each representation of a multiplicative relationship? Compare these representations.
Interactive popup. Assistance may be required.
What value is being multiplied by the number of tickets sold in order to generate revenue for the movie theater?
Central Texas Marble |
|||||
Volume (cubic meter) |
1 |
1.5 |
2 |
2.5 |
3 |
Mass (kilograms) |
2,560 |
3,840 |
5.120 |
6,400 |
7,680 |
Write an equation that relates V, the volume of a piece of marble, to m, the mass of the same piece of marble.