In this section, you will investigate different ways to represent an additive relationship.
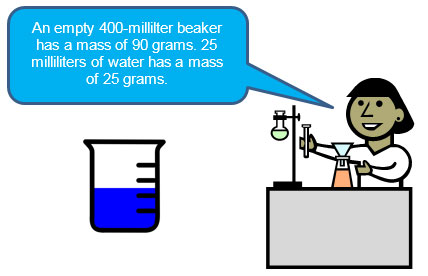
For example, consider the mass of a beaker containing different amounts of water.
 Use the interactive below to determine the mass of the beaker and water as more water is poured into the beaker. Record the combined mass in a table like the one that follows. Copy the following table into a word processing or spreadsheet app or program, and use the program or app to complete the table.
Use the results from the interactive to complete the table you created.
Volume of Water Added (milliliters) |
Mass of Water Added (grams) |
Total Mass (grams) |
0 mL |
0 g |
90 g |
25 mL |
25 g |
|
50 mL |
50 g |
|
75 mL |
||
100 mL |
||
125 mL |
||
150 mL |
Interactive popup. Assistance may be required.
Volume of Water Added (milliliters) |
Mass of Water Added (grams) |
Total Mass (grams) |
0 mL |
0 g |
90 g |
25 mL |
25 g |
115 g |
50 mL |
50 g |
140 g |
75 mL |
75 g |
165 g |
100 mL |
100 g |
190 g |
125 mL |
125 g |
215 g |
150 mL |
150 g |
240 g |

Use your completed table and the interactive to answer the questions that follow.
Interactive popup. Assistance may be required.
The total mass is always 90 grams more than the mass of the water.
Interactive popup. Assistance may be required.
t = w + 90
Use the interactive below to plot the points from the table of values that you just generated. Drag each point from the bank to its correct place on the coordinate grid below.
Use your completed graph to answer the questions that follow.
Interactive popup. Assistance may be required.
y = x + 90
Interactive popup. Assistance may be required.
This equation, y = x + 90, is the same as t = w + 90. In the graph, x represents the same independent variable, the mass of the water, as the variable w represents in the table of values. In the graph, y represents the same dependent variable, the total mass of the beaker and water, as the variable t represents in the table of values.
So far, you have used verbal descriptions, tables, graphs, and equations to represent an additive relationship. Now, take a closer look at how the relationships are related.
Click on each representation to see how the independent variable, dependent variable, and constant addend appear in that representation.
How does the constant addend, a, appear in each representation of an additive relationship? Compare these representations.
Interactive popup. Assistance may be required.
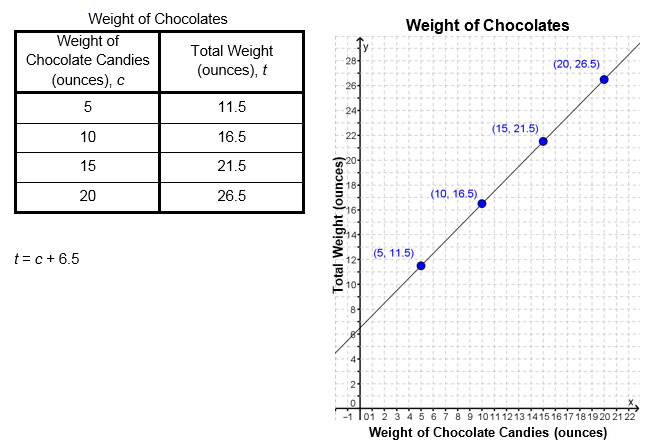
What value is being added to the weight in ounces of the chocolate candies being packaged?
Electoral Votes and Representatives of U.S. States |
|||||
| State | California |
Texas |
New York |
Florida |
Illinois |
| Number of U.S. Representatives | 53 |
32 |
29 |
25 |
19 |
| Number of Electoral Votes | 55 |
34 |
31 |
27 |
21 |
Write an equation that relates r, the number of U.S. Representatives, to e, the number of electoral votes for each state.
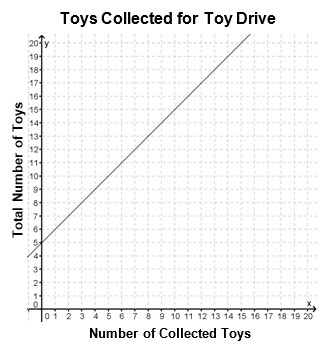
Write an equation that relates x, the number of additional toys that Jacob collected, to y, the total number of toys collected in the toy drive.