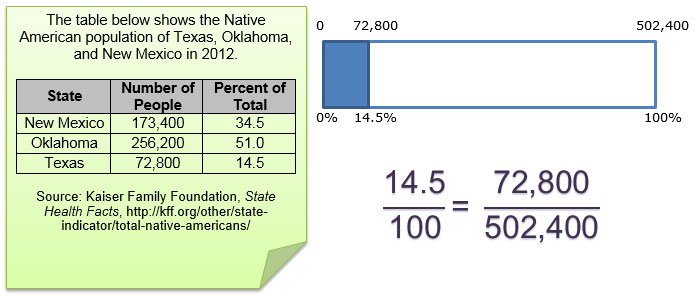
In the previous section, you used a percent bar and the percent proportion to represent the relationship among the part, whole, and percent for a given problem situation. For example, consider the problem below, the percent bar that can be used to represent the problem, and the percent proportion that can be used to determine the exact solution to the problem.

In this section, you will use what you know about percent bars and the percent proportion to solve application problems involving percents.
Consider the problem below.

Mr. Martinez is giving a 60 question final exam in his social studies classroom. Steve figures that he needs to answer 75% of the questions correctly in order to pass the semester. How many questions does Steve need to answer correctly in order to pass the semester?
![]() Use the information in the problem to set up a percent bar to estimate the solution.
Use the information in the problem to set up a percent bar to estimate the solution.
![]() Drag the tiles to create a percent proportion that can be used to determine the exact solution to the problem.
Drag the tiles to create a percent proportion that can be used to determine the exact solution to the problem.
Use your percent bar and percent proportion to answer the following questions.
Interactive popup. Assistance may be required.
Steve needs to answer 45 questions correctly in order to pass.
Interactive popup. Assistance may be required.
Both the percent bar and percent proportion represent the ratio of the part (number of questions Steve must answer correctly) to the whole (total number of questions on the exam). The percent bar is a pictorial representation, and the percent proportion is a numerical representation of the same ratio.
Consider the problem below.

In September 2014, the two states that produced the most crude oil were Texas and North Dakota. Texas produced 97.6 million barrels of oil and North Dakota produced 35.5 million barrels of oil. The entire oil production for the United States in September 2014 was 265.3 million barrels of oil. What percent of the oil produced in the United States was produced in Texas?
![]() Use the information in the problem to set up a percent bar to estimate the solution.
Use the information in the problem to set up a percent bar to estimate the solution.
![]() Drag the tiles to create a percent proportion that can be used to determine the exact solution to the problem.
Drag the tiles to create a percent proportion that can be used to determine the exact solution to the problem.
Use your percent bar and percent proportion to answer the following questions.
Interactive popup. Assistance may be required.
About 36.8% of the total U.S. oil production was produced in Texas.
Interactive popup. Assistance may be required.
Both the percent bar and percent proportion represent the ratio of the part (number of barrels of oil produced in Texas) to the whole (total number of barrels of oil produced in the U.S.). The percent bar is a pictorial representation, and the percent proportion is a numerical representation of the same ratio.
Consider the problem below.

In December 2014, there were 380,000 acre-feet of water in Lake Lewisville, which is 67.5% full. What is the capacity of Lake Lewisville in acre-feet when it is completely full?
![]() Use the information in the problem to set up a percent bar to estimate the solution.
Use the information in the problem to set up a percent bar to estimate the solution.
![]() Drag the tiles to create a percent proportion that can be used to determine the exact solution to the problem.
Drag the tiles to create a percent proportion that can be used to determine the exact solution to the problem.
Use your percent bar and percent proportion to answer the following questions.
Interactive popup. Assistance may be required.
About 563,000 acre-feet
Interactive popup. Assistance may be required.
Both the percent bar and percent proportion represent the ratio of the part (current amount of water in Lake Lewisville) to the whole (total capacity of Lake Lewisville). The percent bar is a pictorial representation and the percent proportion is a numerical representation of the same ratio.
How can you use a percent bar and a percent proportion to solve a problem involving percents?

Interactive popup. Assistance may be required.
Identify the percent, part, and whole from the problem. Set up and solve a percent proportion.

Interactive popup. Assistance may be required.
Identify the percent, part, and whole from the problem. Set up and solve a percent proportion.
Interactive popup. Assistance may be required.
Identify the percent, part, and whole from the problem. Set up and solve a percent proportion.