
In the previous two sections, you compared different ways of describing a "typical" value in a data set, or measures of central tendency.
It is also important to be able to describe how the data set varies, or in other words, how the numbers in the data set are spread out.
Consider the data shown.
Population of 10 Least Populated Texas Counties |
|
County |
Population |
Loving County |
82 |
King County |
286 |
Kenedy County |
416 |
Borden County |
641 |
McMullen County |
707 |
Kent County |
808 |
Roberts County |
929 |
Terrell County |
984 |
Sterling County |
1143 |
Motley County |
1210 |
The range is a basic measure of variability since it tells you the difference between the highest value (maximum) and the lowest value (minimum).
→ What is the range of the data presented in the table?
Interactive popup. Assistance may be required. Subtract the lowest value from the highest value. Interactive popup. Assistance may be required.
Range = 1,210 – 82 = 1,128
Interactive popup. Assistance may be required.
Range = 1,210 – 82 = 1,128
There are other ways of measuring variability. One of these methods is using quartiles. Quartiles break the data set down into four equally-sized parts, and give numerical guidance on the spread of the data. There are three quartiles used to separate data into four different parts. Think of quartiles like a percent bar.
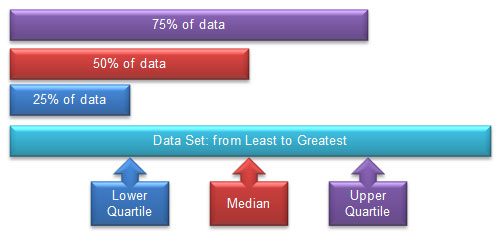
To determine quartiles, think about the median (midpoint) in a data set.
 Use the interactive below to determine the median and quartiles of the 10 Texas counties with the smallest populations. First, list the data values in order from least to greatest.
The difference between the lower quartile and the upper quartile is called the interquartile range. The interquartile range tells you the spread of the middle 50% of the data set.
For the 10 Texas counties with the smallest population, calculate the interquartile range.
Interactive popup. Assistance may be required. Interquartile Range (IQR) = Upper Quartile – Lower Quartile
Interactive popup. Assistance may be required.
IQR = 984 – 416 = 568
What does the interquartile range mean in the context of the data?
Interactive popup. Assistance may be required. The interquartile range tells you the spread of the middle 50% of the data set.
Interactive popup. Assistance may be required.
Of the 10 Texas counties with the smallest population, five of them have a population between 416 and 984, which is a range of 568 people.
Use the following information for questions 1 - 5.
For all 254 Texas counties, the five-number summary for the 2010 population is :
2010 Texas County Population Five Number Summary |
||
Date Measure |
County |
Population |
Minimum |
Loving |
82 |
Lower Quartile |
Dallam |
6,703 |
Median |
(between Bosque and Young) |
18,381 |
Upper Quartile |
Kerr |
49,625 |
Maximum |
Harris |
4,029,459 |
Identify the data measure that each of the following statements best interprets.
6. Shanika runs a website for her small business. She recorded the number of hits that her website received in a two week period.
| 107 | 250 | 672 | 306 | 440 | 516 | 376 |
| 110 | 317 | 486 | 530 | 302 | 286 | 107 |
Calculate the interquartile range for Shanika's set of data. Use the grid below to record your answer. Type your answer in the boxes in front of and behind the decimal. Click inside each box to enter the numeral that belongs in the box, and then click the bubble beneath the numeral to shade the bubble that matches the numeral. After hitting the "Submit" button, incorrect portions of your answer will be shaded gray.