 Click on the clipboard to review the definitions.
In the previous section, you found the data’s center. In this section, you will look at the entire spread of the data. When interpreting data, the spread of the data is as important as the center. The range tells us how far apart the data is. The interquartile range or IQR tells us information around the median or center of the data and functions as a means to eliminate outliers that would be included in the range.
Click on the clipboard to review the definitions.
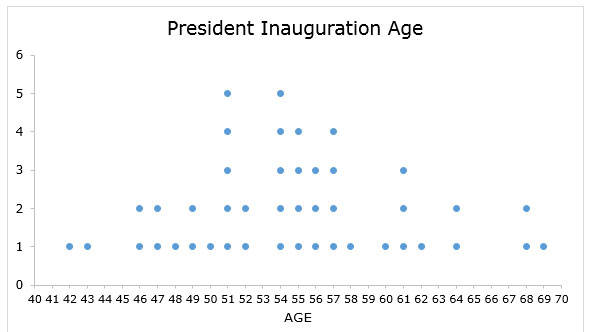
Use the clipboard and the dot plot below to answer the following questions. In the previous section, you saw that the mean and median for the ages of the US Presidents when they were inaugurated (54.72 and 54.5). Below is the same dot plot.
Remember, the U.S. Constitution decrees that the president must be at least 35 years old.
Interactive popup. Assistance may be required.
Read the definitions on the clipboard, and discern the difference by using an example from data given.
Interactive popup. Assistance may be required.
The youngest president would be represented as the dot on the plot that is farthest to the left.
Interactive popup. Assistance may be required.
The oldest president would be represented as the dot on the dot plot the farthest to the right.
Interactive popup. Assistance may be required.
Subtract the age of the youngest from the age of the oldest president.
The interquartile range is a measure of where the middle half of the data is located. The information provided by the interquartile range will exclude outliers and may give a more accurate picture of the information.
To practice finding the interquartile range, use the 10 question assessment scores from Mr. Smith’s fourth period ELA class, located at the beginning of section 2.
The students’ assessment scores are as follows.
70, 60, 80, 90, 50, 100, 80, 90, 80, 70, 50, 90, 100, 90, 80, 70, 70, 80, 90, 80, 100, 100, 70, 80, 80
Follow the steps below to find the interquartile range of the assessment scores.
Use the information from the interactive about interquartile range to answer the following:
Find the interquartile range of the following data.
14, 19, 23, 12, 15, 18, 15, 16, 15, 16, 17, 14
 12, 14, 14, 15, 15, 15, 16, 16, 17, 18, 19, 2312, 14, 14, 15, 15, 16, 17, 18, 19, 23
A fascinating age group made popular by the television show “Shark Tank” is a group of young people who became millionaires before they reached the age of 20. Below is a box plot and a histogram depicting the ages of young millionaires.
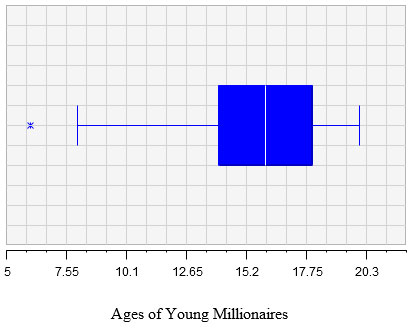
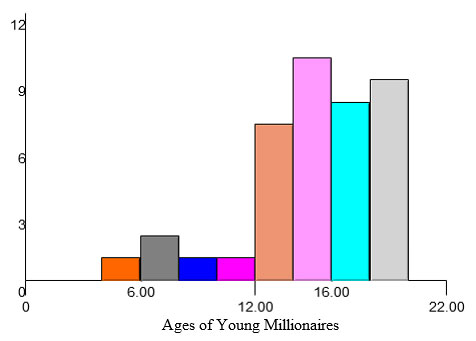
Use the graphs to answer the following questions:
Interactive popup. Assistance may be required.
First, find the age of the youngest millionaire which is the age farthest to the left, and then find the age of the oldest millionaire which is the age farthest to the right. Next, subtract the ages.
Interactive popup. Assistance may be required.
The median is the number in the middle. Since there are only a few very young millionaires, the median would be closer to the right.
Interactive popup. Assistance may be required.
First, find the median of the first and third quartiles, and then subtract the median of each quartile.