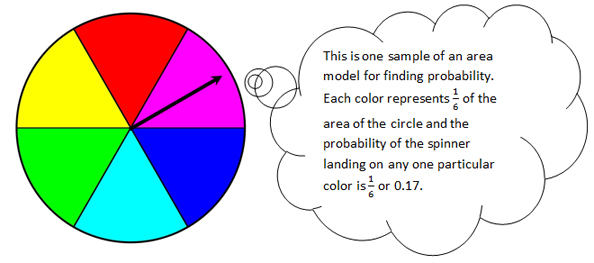
You probably remember learning simple probability in elementary school using a spinner like this:
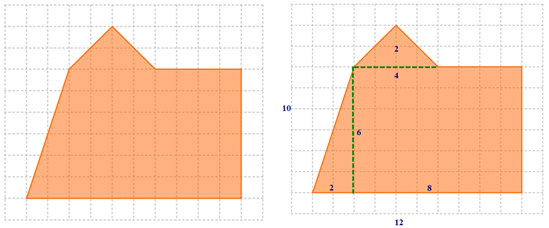
Other area models use combinations of geometric shapes, called composite figures. For instance, the polygon below is on a grid and could be divided into two triangular regions and one rectangular region. The area of the polygon can be computed using these smaller regions (58 square units) and the probability of a bean bag thrown on this target can be computed by comparing the area of the polygon to the area of the entire region (120 square units).
P(A) = 58 over 120 58 120 = 29 over 60 29 60 = 0.48
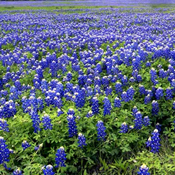
Source: Field of Texas bluebonnets, bombay2austin, Flickr
The Better Bluebonnet Company is experimenting with a new seed broadcasting tool that will save time during the planting season. Their irrigation system will water from an arm that rotates around their field from the center (like the minute hand on a clock). The broadcasting tool allows the seeds to be randomly placed in a square field 2 miles long. Use the composite shape to determine the probability of the seeds landing in and out of the irrigation area.
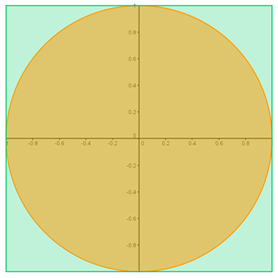
| Determine the following: | Answers: |
| Area of the Circle (round to 2 decimal places) | Interactive button. Assistance may be required. __________ 3.014 square milees |
| Area of the Square | Interactive button. Assistance may be required. __________ 4 square milees |
| Area of the Square not covered by the Circle | Interactive button. Assistance may be required. __________ 0.86 square miles |
| Probability of a seed landing on the Circle | Interactive button. Assistance may be required. __________ 0.79 |
| Probability of a seed landing in the area of Square not covered by the circle | Interactive button. Assistance may be required. __________ 0.21 |
During the first trial of their new seed broadcasting equipment, the folks at the Better Bluebonnet Company wanted to see how well it was covering the area of the field where they were irrigating.
Instead of plotting all the points landed in the entire field, the team picked just one quarter of the field to use in a comparison study. Use the information in the plot below to determine the probability of the seeds that actually landed in the circle and the seeds that landed outside the circle. Each point on the graph represents where a seed landed during the trial.
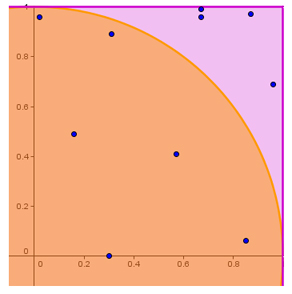
| Probability of a seed landing on the Circle | Interactive button. Assistance may be required. __________ 0.60 |
| Probability of a seed landing in the area of Square not covered by the circle | Interactive button. Assistance may be required. __________ 0.40 |
How close to the theoretical probability did this experimental sample come?
Interactive popup. Assistance may be required.
Not very close. If this is really how the broadcasting equipment works, the company will loss 40% of its seed to the area that isn't irrigated.
Is this sample large enough to be a true indicator of how the seeds will broadcast every time?
Interactive popup. Assistance may be required.
No the sample needs to be larger to see if it really does come close to the theoretical probability.
The Better Bluebonnet team decided to collect a larger sample and collected the locations of 40 seeds that were broadcasted over the field. Use the new information in the plot below to determine the probability of the seeds that actually landed in the circle and the seeds that landed outside the circle.
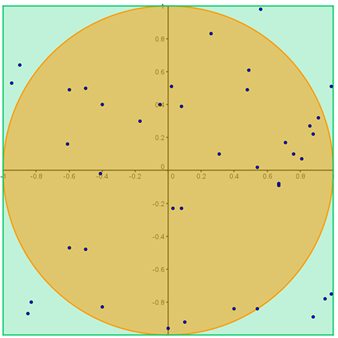
| Probability of a seed landing on the Circle | Interactive button. Assistance may be required. __________ 0.78 |
| Probability of a seed landing in the area of Square not covered by the circle | Interactive button. Assistance may be required. __________ 0.78 |
How close to the theoretical probability did this experimental sample come?
Interactive popup. Assistance may be required.
Much closer. If this is really how the broadcasting equipment works, the company will only lose 23% of its seed to the area that isn't irrigated, which is only 1% more than was expected when looking at the theoretical probability.
Is this sample large enough to be a true indicator of how the seeds will broadcast every time?
Interactive popup. Assistance may be required.
Yes, the probabilities of this sample are almost the same as the theoretical probability.
Return to your notes and answer the following prompt:
When comparing experimental and theoretical probability . . .
Interactive popup. Assistance may be required.
When comparing experimental and theoretical probability the larger the sample in the experiment the more its probability will match the theoretical probability.