Now that you have solid understating of graphing lines that are parallel and perpendicular, solve the following situation using a coordinate grid.
Use the Cool Math online calculator or your own graphing calculator to graph the following designs made with linear equations.

 Graphing Calculator
- Thomas had $40 in his savings account at the beginner of the summer. His neighbor offered him $35 to mow his lawn each week during the summer. Thomas decided to deposit $20 of the $35 each week to build up his savings.
- What equation would model Thomas’ situation?
- How much money would Thomas have in his savings account after 15 weeks?
- How many weeks would Thomas need to save at his current rate to buy a new cell phone that cost $345.00?
- Jasmine owed her brother $40 at the beginning of the summer. Her neighbor also offered her $35 to mow his lawn each week during the summer. Jasmine also wanted to save $20 each week to build up her savings.
- What equation would model Jasmine’s situation?
- How much money would Jasmine have in her savings account after 15 weeks?
- If Jasmine wanted to purchase the same cell phone as Thomas, how many weeks would it take her to save it?
- How do the graphs for the models of Thomas’ savings and Jasmine’s savings compare?
- How do the equations for the models of Thomas’ savings and Jasmine’s savings compare?
- How did you use the graph to determine the answers to the questions above?
- Money spent on medical research is increasing each year. The graph below compares the amount spent on cancer research to the amount spent on heart disease research since 1992.
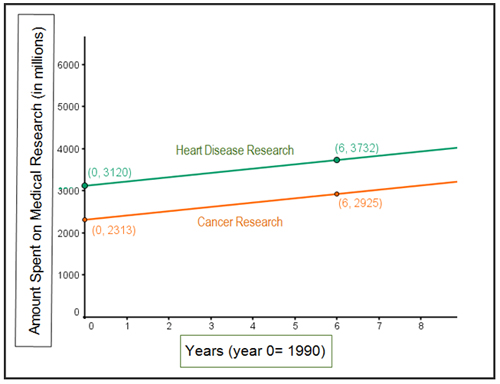
- Find the equation of the each line that models the research dollars spent.
Cancer Research____________
Heart Disease Research __________
- What is the rate of change spent on spent on the research?
Cancer Research____________
Heart Disease Research __________
- Use the equations to predict the amount that will be spent in the year 2020 if spending continues at the current rates.
Cancer Research____________
Heart Disease Research __________
- How do the two graphs compare?
- According to the model, is there a time when the amount of spending for both types of research be the same?
- Many times in mathematics, we are asked to find equations. Using the information in the graph below, find the equation of the line given. Then, find the equations of the lines that are parallel to and perpendicular to the given line which passes through the point (0, 9).
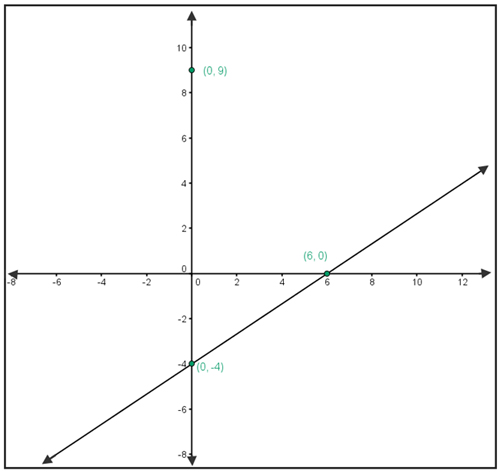
- Original line____________________
- Parallel to the original through (0,9)____________________
- Perpendicular to the original through (0,9)____________________
- How does the original line compare to the parallel line?
- How does the perpendicular line compare to the original?
