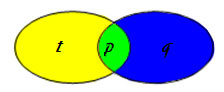
The green represents the intersections of the two sets.
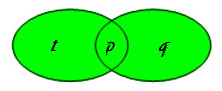
The green represents the union of the two sets.
| The Venn Diagram can be used to help illustrate the validity of conditional statements. - The "p" represents the hypothesis - The "q" represents the conclusion |
This shows every member of set "p" is a member of set "q".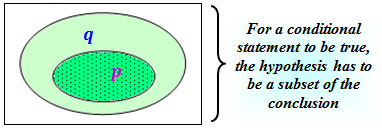
 Move the correct labels for the hypotheses and conclusions to the Venn Diagrams for the conditional statements below.
For a conditional statement to be true, the hypothesis has to be a subset of the conclusion.