 Click in each of the empty cells in the table to reveal the values. When you reveal a complete point in the table, the same point will plot on the graph. When all points are plotted, you will see the complete graph.
 You can read a table or a graph to solve square root equations. Work through the following problems.
Problem 1: Given the square root equation y = √(2x + 16) − 4, watch how the points in the table correspond to the same points on the graph.
Click in each of the empty cells in the table to reveal the values. When you reveal a complete point in the table, the same point will plot on the graph. When all points are plotted, you will see the complete graph.
Problem 2: Given y = √(x − 4), answer the following.
Find the domain for this function to determine which x-values are not acceptable. Find the domain for this function.

Now you know that you shouldn't pick any x-value that is less than 4 for your table of values or graph. You should also know that your graph should start at x = 4 and go to the right. See the graph of this equation below.
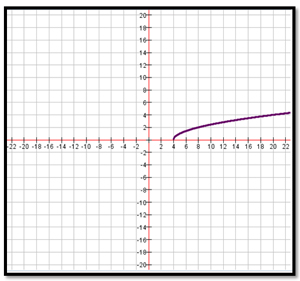
Can y = -10 be a solution to this problem?
Use the graph to solve the equation √x − 4 = 4 (in other words, the value of x when y = 4).
Problem 3: The following tables represent some of the values for the equation y = √(8x − 7). Use the table to determine the value of x for the equation 3 = √8x − 7.
| X | Y |
|---|---|
| seven-eigths 7 8 | 0 |
| 1 | 1 |
| 2 | 3 |
| 4 | 5 |
| 7 | 7 |
From this lesson, you learned how to solve square root equations using tables and graphs. For additional explanations and examples, as well as demonstrations, visit the related items section.