In this section, you will create a graph from a quadratic equation.

Before graphing a parabola, there are three things you need to do:
If the equation is in vertex form, y = a (x – h)2 + k where a ≠ 0, then (h, k) is the vertex.
Also, the axis of symmetry must pass through the vertex point of (h, k) and it is a vertical line, which means the equation for the axis of symmetry is x = (x-coordinate of the vertex) h.
Graph y = (x + 2)2 – 3
Step 1: Find the vertex using the vertex formula: y = a (x – h)2 + k
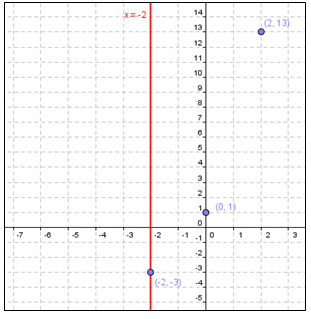
The vertex is at (- 2, - 3) since the equation is in vertex form → h = - 2 and k = - 3.
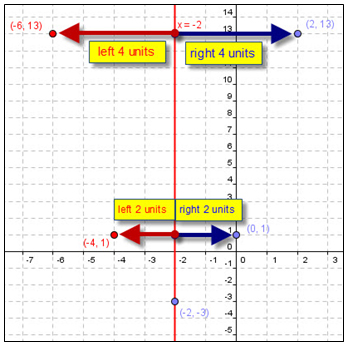
The axis of symmetry is the vertical line that passes through the vertex and its equation is x = - 2.
Let’s pick x = 0 and x = 2. (You may choose any number for x, but it is usually easier to work with integers.)
Substitute: x = 0 → y = (0 + 2)2 – 3 → so y = 1 → (0, 1)
Substitute: x = 2 → y = (2 + 2)2 – 3 → so y = 13 → (0, 13)


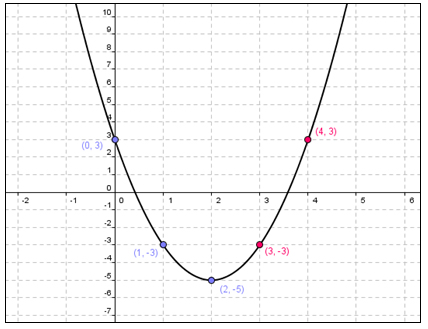
Graph y = 2x2 – 8x + 3
When a quadratic equation is written in standard form, you will still follow the same steps.
Step 1: Find the Vertex—The vertex isn’t obvious when a quadratic equation is written in standard form.
x = − b over 2a
b
2a
= −
x = − negative eight over two times two
(-8)
2(2)
= −
x = − negative eight over four
(-8)
4
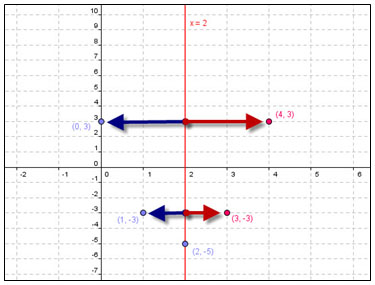
= −(-2) = 2
(Note: this is also the axis of symmetry.)
y = 2x2 – 8x + 3
y = 2(2)2 – 8(2) + 3
y = 8 – 16 + 3
y = - 5
Let’s pick x = 0 and x = 1.
Substitute x = 0 → y = 2(0)2 – 8(0) + 3 → so y = 3 → (0, 3)
Substitute x = 1 → y = 2(1)2 – 8(1) + 3 → so y = - 3 → (0, - 3)

