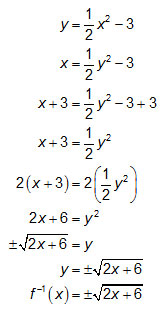
In previous sections, you defined the inverse of a function and found the inverse of the functions represented in tables or from equations. In this section, you will find the inverse of a function that is graphed. Remember, the inverse of a function, f -1(x), is the result from exchanging the x- and y-values or they do and undo each other.
On your graph paper, write the equation and then graph it. If you need some graph paper you can print it.


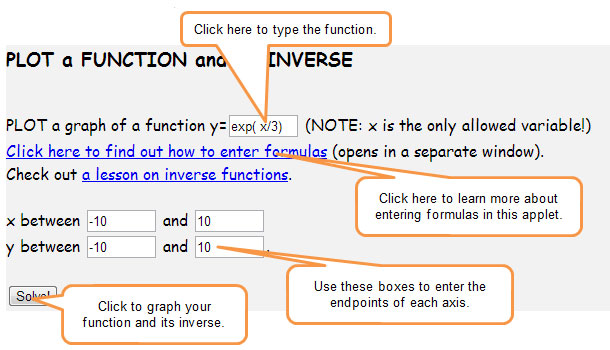
![]() Once you finish graphing, click on the image below and enter the equations one at a time in the box y =
Once you finish graphing, click on the image below and enter the equations one at a time in the box y =  on the page.
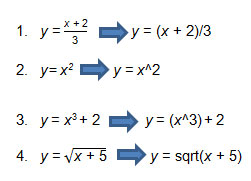
Note: Type the equations in the form written below.
After you type the equation into the box, click “Solve” to show the original graph of the function in RED and the inverse is shown in GREEN.
Graph the inverse on your graph paper.
Interactive popup. Assistance may be required.

Interactive popup. Assistance may be required.
Some sample coordinates are (-2, 0), (1, 1), and (3, 12 over 3 2 3 ). Their corresponding coordinates on the inverse of the function are (0, -2), (1, 1), and (12 over 3 2 3 , 3).
Interactive popup. Assistance may be required.
The coordinates of the function are the ordered pairs (x, y), and the coordinates of the inverse of the function are the ordered pairs (y, x).
Interactive popup. Assistance may be required.
The function and the inverse of the function are reflections across the line y = x.
Interactive popup. Assistance may be required.
The graph of an inverse of a function f -1(x) is the reflection of the graph of the function f(x) across the line y = x.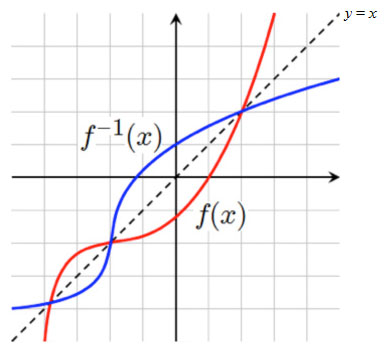

Explain how the inverse functions of a table, an equation, and a graph are similar.

If you were given a graph and its equation, compare the method for finding the inverse of the function by graphing with the method of finding the inverse of the function by using the equation.
Interactive popup. Assistance may be required.
You can use the applet above to find the graph or find the inverse of the equation then graph it.
Interactive popup. Assistance may be required.
The BLUE graph is the function and the PINK graph is the inverse of the function.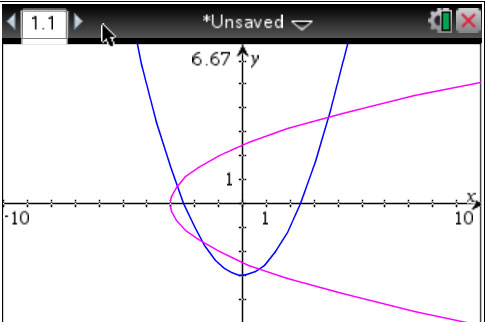

Interactive popup. Assistance may be required.
You can use the applet above to find the graph or find the inverse of the equation then graph it.
Interactive popup. Assistance may be required.
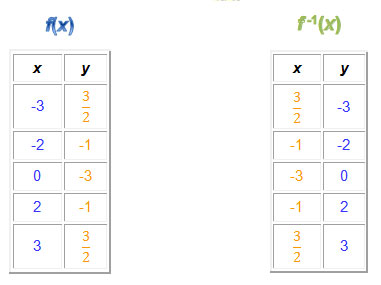

Interactive popup. Assistance may be required.
Exchange the x’s and y’s then solve for y.
Interactive popup. Assistance may be required.
