In this section, the change in “h” will be evaluated in the function f(x) = a | x − h | + k.
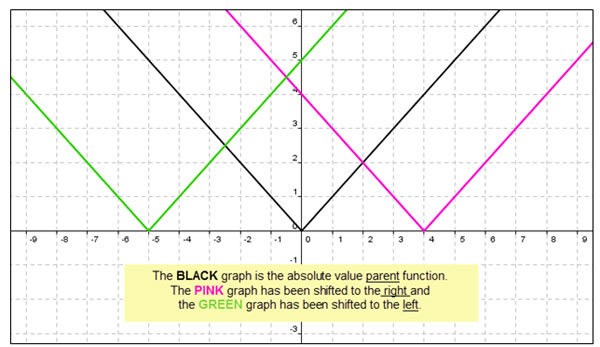
The absolute value function f(x) = a | x − h | + k translates the absolute value graph to the left or right.
What happens if we change “h” in y = a | x – h | + k ?
 To view the affects “h” has on the absolute value function, view this applet and slide the second slider in the lower left hand corner back and forth observing the change in the graph.
Evaluate the function by looking at these tables of values.
y = | x |
x |
y |
4 |
4 |
3 |
3 |
2 |
2 |
1 |
1 |
0 |
0 |
-1 |
1 |
-2 |
2 |
-3 |
3 |
-4 |
4 |
and
y = | x − 2|
x |
y |
4 |
2 |
3 |
1 |
2 |
0 |
1 |
1 |
0 |
2 |
-1 |
3 |
-2 |
4 |
-3 |
5 |
-4 |
6 |
and
y = | x + 2 |
x |
y |
4 |
6 |
3 |
5 |
2 |
4 |
1 |
3 |
0 |
2 |
-1 |
1 |
-2 |
0 |
-3 |
1 |
-4 |
2 |
**Notice the y – values in all three tables are greater than or equal to zero. Since zero is the smallest number in all three, that is the vertex, or the turning point, of each of the graphs. In the second table, the vertex is at (2,0), moving the graph 2 units to the right; and in the third table, the vertex is at (-2,0), moving the graph 2 units to the left.
When “h” is positive, the absolute value graph moves to the _______.
When “h” is negative, the absolute value graph moves to the _______.
