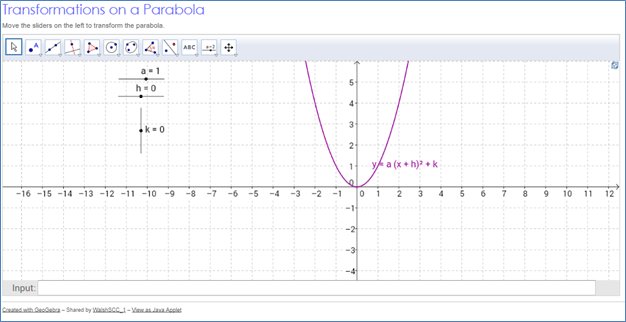
Let's first focus our attention on y = x2. Let's look at how to transform the graph of this parabola.
The graph can be changed by changing the parameters a, h, and k in the equation y = a(x – h)2 + k.
You can:
- translate (shift) the graph left or right
- translate (shift) the graph up or down
- reflect the graph over the x-axis
- vertically stretch or compress the graph to make it appear narrower or wider
We are going to look at those parameter changes in the activity below. Notice that in this equation, the x-term is still being squared. Remember - whenever the equation is in this form, and the x-term is being squared, the graph is a parabola that opens up or down.
Look at this form of a parabola:
y = a (x – h)2 + k
 Click on the image below to begin the interactive exercise. Follow the instructions below.

The Effects of a
- Change the value of the slider for the a parameter.
- What happens when it changes from positive to negative?
- What happens when a becomes more and more positive?
- What happens when a becomes more and more negative?
The Effects of h and k
- Click the RESET button (the double circular arrows in the top right corner of the interactive).
- Change the value of the slider for the h parameter.
- What happens when h changes from 0 to a positive value?
- What happens when h changes from 0 to a negative value?
- Click the RESET button (the double circular arrows in the top right corner of the interactive).
- Change the value of the slider for the k parameter.
- What happens when k changes from 0 to a positive value?
- What happens when k changes from 0 to a negative value?
Now that you have reviewed those parameter changes, it's important to note a few details. The equation is generalized as y = a (x – h)2 + k. When h was positive, the graph shifted left. When h was negative, the graph shifted right. Likewise, when k was positive, the graph shifted up. When k was negative, the graph shifted down.
Check Your Understanding


![]() Click on the image below to begin the interactive exercise. Follow the instructions below.
Click on the image below to begin the interactive exercise. Follow the instructions below.


