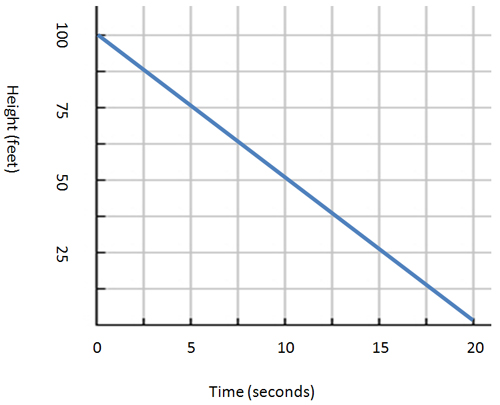
Vicki is climbing down a 100 foot hill at a rate of 5 feet per second. On your own paper, create a table, equation, and graph to represent Vicki’s height from the bottom of the hill with relation to time. When will she reach the ground? Check your answers when you have completed each representation.
The equation for this relationship is:______________________
Make a table of values for this relationship:
| Time(s) | Height (ft) |
| 0 | 100 |
| 5 | |
| 10 | |
| 15 | |
| 20 |
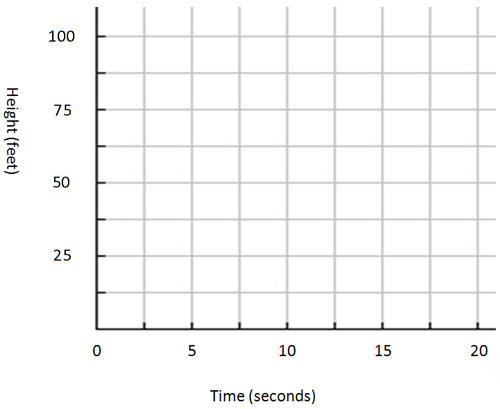
Make a graph from this functional relationship:
The domain and range for this functional relationship is
Domain:_____________ Range:_____________
| Time(s) | Height (ft) |
| 0 | 100 |
| 5 | 75 |
| 10 | 50 |
| 15 | 25 |
| 20 | 0 |