When you are asked to find the domain and range from the graph of a function given the equation, it will be easier to see why the graph looks a certain way and what kind of function is graphed. In other words, the characteristics for the function will be similar to the parent function.
For example, the graph of the function pictured above should indicate to you that it is not a linear (y = mx + b) function because this is not the graph of a line which would show the domain and range to be all real numbers. All linear function domains and ranges are always all real numbers.
It is not a quadratic function (y = x2) because it is not a parabola.
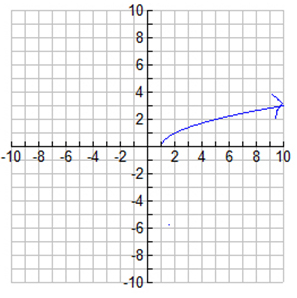
This is the graph of the radical equation √x − 1. Since the graph begins at (1,0), this tells us the beginning points of the domain and range. The domain is { x| x ≥ 1 }which is read as "the set of all x's such that x is greater than or equal to 1." The range is { y| y ≥ 0 } which is read as "the set of all y's such that y is greater than or equal to zero." This notation is called set builder notation.