In this resource, you will determine the domain and range from the graph of a function.
When you are given the graph of a function and asked to find the domain and range, you must look at the x-axis for the domain and the y-values for the range. Be sure to pay attention to any open or closed circles, as this will indicate whether or not a particular value is to be included in the domain and/or the range.
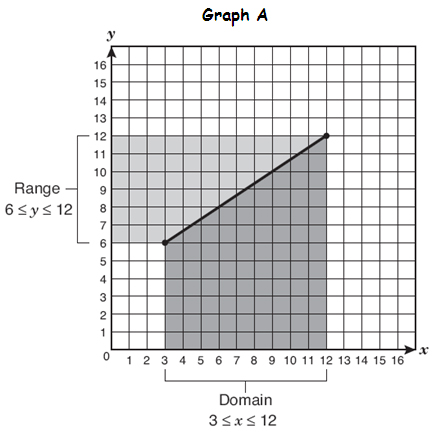
Let’s look at an example:
In this graph, you can see that the domain includes only the x-values from 3 to 12 and the range only includes the y-values from 6 to 12.
Follow the link below to look at several examples. Notice the animations and how the domain and range is recorded on the graphs. Think about which graphs are continuous (no breaks in the graph) and which graphs are discrete (breaks in the graph).