
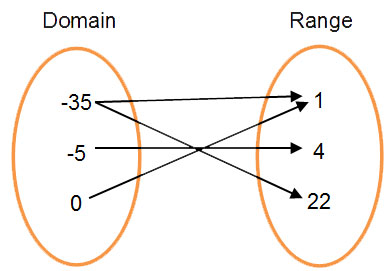
In addition to order pairs and tables, mapping diagrams are another way to represent domain and range.
A mapping diagram shows the elements of the domain and range in an arrangement that connects each element of the domain to the appropriate element of the range with arrows.
The example below represents this format. Please note that the number of elements in the domain and range do not have to be the same. However, each element in the domain connects to only one element in the range.
 Click on each of the ordered pairs below to watch how they connect to each other in the mapping diagram.
Interactive popup. Assistance may be required.
D: {-4, -2, 0, 2, 4}
Interactive popup. Assistance may be required.
R: {0, 4, 8}
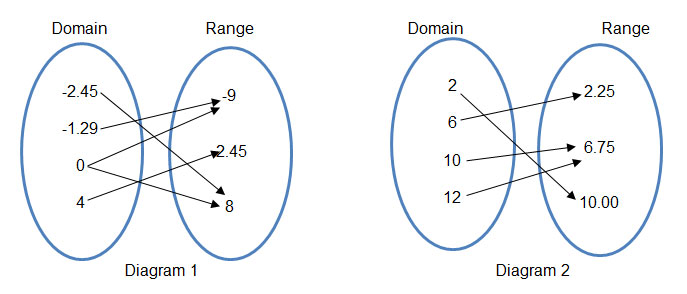
Mapping diagrams give you a visual representation of the domain and range. You can use this representation to easily tell if the relation is a function. When there is only one output value for each input value, the relation is a function. Use this information to determine whether the following relation is a function.
{(2, 3), (-4, 5), (9, 0), (-2, 3)}
Interactive popup. Assistance may be required.
The first number in the ordered pairs is in the domain and the second number is in the range. Draw an arrow from each domain value to its corresponding range value.
Interactive popup. Assistance may be required.
The domain is the set of input values, and the range is the set of output values.
Interactive popup. Assistance may be required.
Look for the mapping diagram that has only one arrow from each domain value.
