A graph is a useful representation for determining the solution of a quadratic equation. To best use a graph, think about a quadratic equation as written in two parts.
Graph each part of the quadratic equation:
Look for the intersection of the two graphs. The x-coordinates of the intersection points will tell you the values of x that are solutions to the original equation.
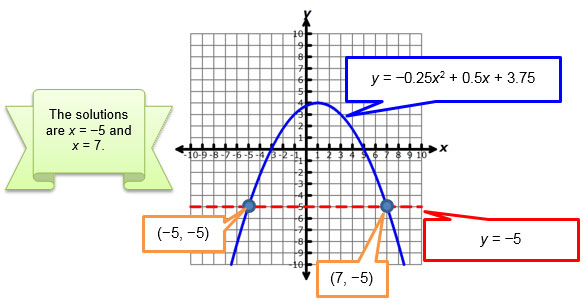
For example, the graph of f(x) = −0.25x2 + 0.5x + 3.75 is shown below. You can use the graph to determine the solutions to the related equation, −0.25x2 + 0.5x + 3.75 = -5.
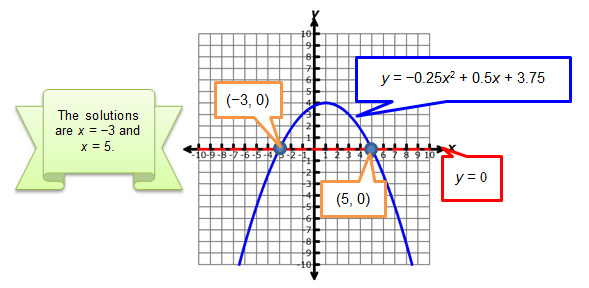
You can also use the graph to solve the equation, -0.25x2 + 0.5x + 3.75 = 0, by identifying the x-intercepts since the x-axis is the same as the line y = 0.