| x | y |
| -3 | 6 |
| -2 | 0 |
| -1 | -4 |
| 0 | -6 |
| 1 | -6 |
| 2 | -4 |
| 3 | 0 |
| 4 | 6 |
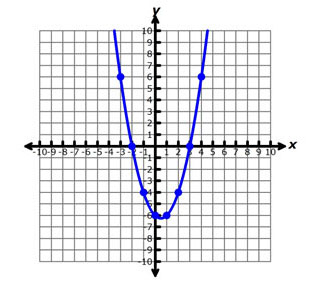
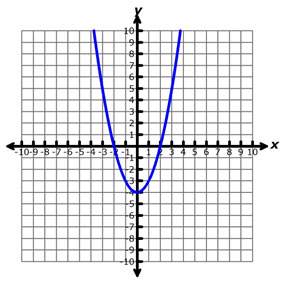
A graph is used to represent points that make a function true. For example, the graph and table below show points for the quadratic function, y = x2 – x – 6.
| x | y |
| -3 | 6 |
| -2 | 0 |
| -1 | -4 |
| 0 | -6 |
| 1 | -6 |
| 2 | -4 |
| 3 | 0 |
| 4 | 6 |
Both the graph and the table of values can be used to solve the equation, x2 – x – 6 = 0, which is related to the function y = x2 – x – 6.
Interactive popup. Assistance may be required.
The x-axis
Interactive popup. Assistance may be required.
(−2, 0) and (3, 0)
Interactive popup. Assistance may be required.
x = 3 and x = −2
 In the interactive below, the graphs represent equations related to the function
y = x2 – x – 6. The red line represents the graph y = k. Match each graph with the equation by dragging the graph to the appropriate slot. Then, indicate the correct solutions represented in the graph by selecting the correct ordered pair(s) from the dropdown menu. You may not use all of the graphs or all of the ordered pair(s). Your dropdown answer box will remain red until you have chosen the correct answer.
 View the video below to learn more about determining the solutions to a quadratic equation.
Source: Evaluating Functions Using a Graphing Calculator, Gdawy Enterprises, You Tube
What do the x-coordinates of the x-intercepts of a quadratic function, f(x), tell you about the solutions of the related quadratic equation, f(x) = 0?
Interactive popup. Assistance may be required.
The x-coordinates of the x-intercepts, which are also the roots of the quadratic function, f(x), are the same as the solutions of the related quadratic equation, f(x) = 0.
How is using a graph of a quadratic function, f(x), to determine the solutions of the related equation, f(x) = k, like using graphs of systems of equations to determine solutions?
Interactive popup. Assistance may be required.
If you draw the line y = k, it will intersect the graph of f(x) at the points representing the solution to the equation, f(x) = k.
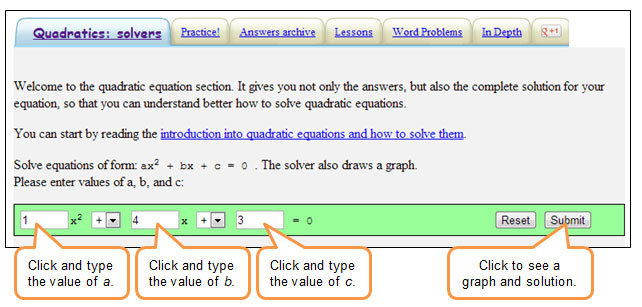
Determine the solution to the each quadratic equation by graphing. Use the quadratic equation solver below to check your answers.
Quadratic Equation Solver
Directions: Click on the link below. Enter the values of a, b, and c into the equation solver. Click "Submit Query" to view the solution.
Interactive popup. Assistance may be required.
Interactive popup. Assistance may be required.
Interactive popup. Assistance may be required.
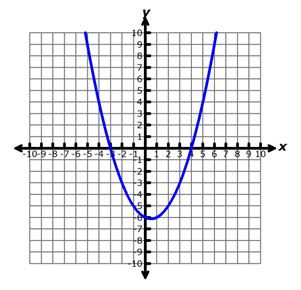
Real solutions occur where the graph crosses the x-axis.
Interactive popup. Assistance may be required.
There are 0 real solutions.
Interactive popup. Assistance may be required.
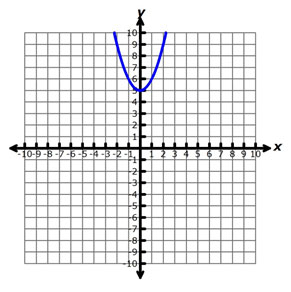
Where does the graph cross the x-axis?
Interactive popup. Assistance may be required.
There are no real solutions.
Interactive popup. Assistance may be required.
Interactive popup. Assistance may be required.
Real solutions occur where the graph crosses the x-axis.
Interactive popup. Assistance may be required.
There are 2 real solutions.
Interactive popup. Assistance may be required.
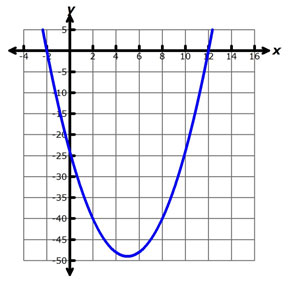
Where does the graph cross the x-axis?
Interactive popup. Assistance may be required.
x = −2 and x = 12
Interactive popup. Assistance may be required.
Interactive popup. Assistance may be required.
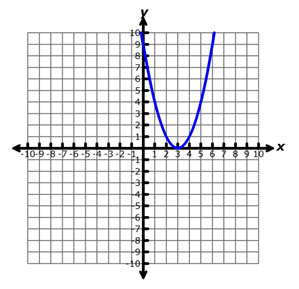
Real solutions occur where the graph crosses the x-axis.
Interactive popup. Assistance may be required.
There are 2 real solutions.
Interactive popup. Assistance may be required.
Where does the graph cross the x-axis?
Interactive popup. Assistance may be required.
x = −2 and x = 2
Interactive popup. Assistance may be required.
Interactive popup. Assistance may be required.
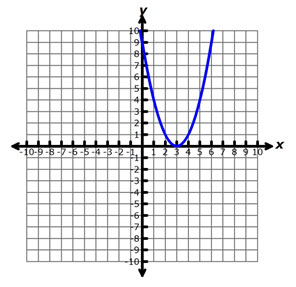
Real solutions occur where the graph crosses the x-axis.
Interactive popup. Assistance may be required.
There is 1 real solution.
Interactive popup. Assistance may be required.
Where does the graph cross the x-axis?
Interactive popup. Assistance may be required.
x = 3
Interactive popup. Assistance may be required.
Interactive popup. Assistance may be required.
Real solutions occur where the graph crosses the line y = 4.
Interactive popup. Assistance may be required.
There are 2 real solutions.
Interactive popup. Assistance may be required.
Where does the graph cross the line y = 4?
Interactive popup. Assistance may be required.
x = 1 and x = 5
Interactive popup. Assistance may be required.
Interactive popup. Assistance may be required.
Real solutions occur where the graph crosses the line y = -3.
Interactive popup. Assistance may be required.
There are 2 real solutions.
Interactive popup. Assistance may be required.
Where does the graph cross the line y = -3?
Interactive popup. Assistance may be required.
x = −2 and x = 3
