Watch the video below. As you do, think about how you can use the table above to estimate the solutions to the equation x2 – 2 = 0.
Sometimes, when you have a table of values for a function, the solutions to the related equation are not obvious. For example, consider the function y = x2 – 2 and its related equation, x2 – 2 = 0.
x |
y = x2 – 2 |
-3 |
7 |
-2 |
2 |
-1 |
-1 |
0 |
-2 |
1 |
-1 |
2 |
2 |
3 |
7 |
If you want to solve the related equation, x2 – 2 = 0, from this table, there are no y-values equal to 0 to use.
Watch the video below. As you do, think about how you can use the table above to estimate the solutions to the equation x2 – 2 = 0.
The graph of y = x2 − 2 is shown in the graph.

Interactive popup. Assistance may be required.
Twice
Interactive popup. Assistance may be required.
The graph crosses the x-axis between −2 and −1 and between 1 and 2.
Use the table of values to estimate the solutions of the related equation, x2 – 2 = 0. Use the interactive below to check your answer.
 To estimate the solutions of this quadratic function given a table, click and follow the steps.
If a table of values does not contain function values equal to 0, how can you use the table to estimate the solutions to a quadratic equation, ax2 + bx + c = 0?
Interactive popup. Assistance may be required.
The solutions will be where the value of the related function is equal to 0, so identify two adjacent rows in the table containing positive and negative function values. The value of x that generates the function value of 0 will lie between the two x-values in these rows.
Given the tables and quadratic functions below, estimate the roots to the related quadratic equations.
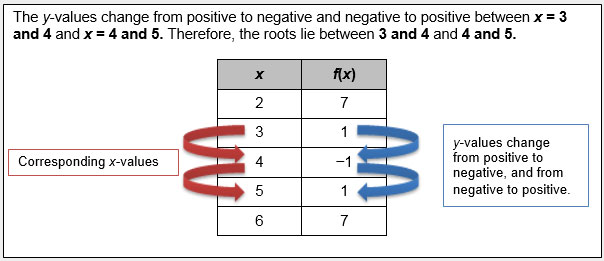
1. f(x) = 2x2 – 16x + 31
x |
f(x) |
2 |
7 |
3 |
1 |
4 |
-1 |
5 |
1 |
6 |
7 |
Interactive popup. Assistance may be required.
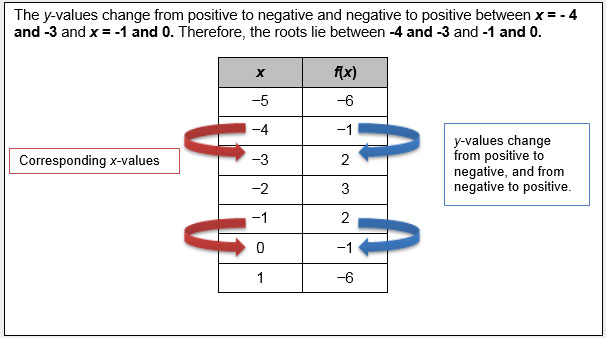
2. f(x) = -x2 – 4x – 1
x |
f(x) |
-5 |
-6 |
-4 |
-1 |
-3 |
2 |
-2 |
3 |
-1 |
2 |
0 |
-1 |
1 |
-6 |