In a previous resource, you used concrete models, such as algebra tiles, to solve quadratic equations. In this resource, you will investigate ways to use a table of values to represent the solution to a quadratic equation.
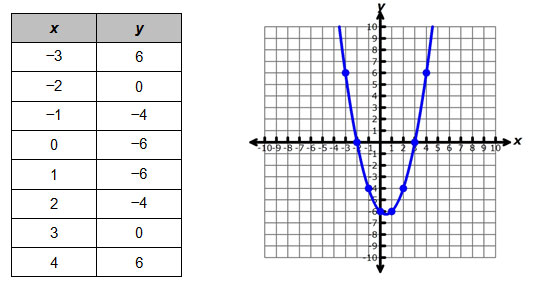
The graph and table below show points for the quadratic function, y = x2 – x – 6.
Both the graph and the table of values can be used to solve the equation, x2 – x – 6 = 0, which is related to the function y = x2 – x – 6. In this resource, you will learn more about using tables to solve equations. In the next resource, you will learn more about using graphs to solve equations.