
 Online Graphing Calculator
In this part of the lesson, you will be investigating how changing the value of c to a number greater than 0 will affect the graph of y = ax2 + c.
Click the link below to access an online graphing calculator. Then follow the directions below to complete the exercise.
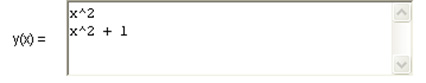
You will be entering quadratic equations in the y(x) field. (Remember, this is function notation. It is just a different way of writing a "y =" equation.) To enter the exponent of the equation, use the ^ symbol which is accessed by pressing "Shift 6". The equation will be written in the y(x) field as x ^ 2. At any time, click on "Show Tabular Data" to see a table of values.
Source: Graphit, Shodor
When the value of c is greater than 0, all points on the graph are shifted up c units.
