In this part of the lesson, you will be investigating how changing the value of a to a number greater than 1 will affect the graph of y = ax2.

Click on the link below to access an online graphing calculator.

This activity might not be viewable on your mobile device.Interactive exercise. Assistance may be required. Graphit

Directions:

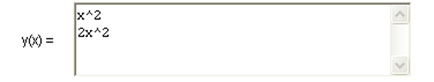
You will be entering quadratic equations in the y(x) field. (Remember, this is function notation. It is just a different way of writing a "y =" equation.) To enter the exponent of the equation y(x) = x2; use the ^ symbol which is accessed by pressing "Shift 6". The equation will be written in the y(x) field as x ^ 2. At any time click on "Show Tabular Data" to see a table of values.

  1. Enter x2 in the y(x) field and then click on Plot/Update to graph the equation.
  2. Go to the next line in the y(x) field and enter 2x2. Then click on Plot/Update. A snapshot of your entries is shown.
  3. Go to the next line in the y(x) field and enter 5x2. Then click on Plot/Update.
  4. In your notes, describe how changing the coefficient of x from "1" to a number greater than 1 affects the graph. (Use the words narrower or wider.)
Interactive popup. Assistance may be required.

Check Your Answer

The larger the value of a the narrower the graph of the function. Close Pop Up