In this lesson, you will explore different representations of quadratic functions, including graphs, verbal descriptions, and tables, and use those representations to determine the domain and range of the quadratic function being represented.
In this section, you will examine graphs of quadratic functions, and learn how to determine the domain and range of a quadratic function from the graph.
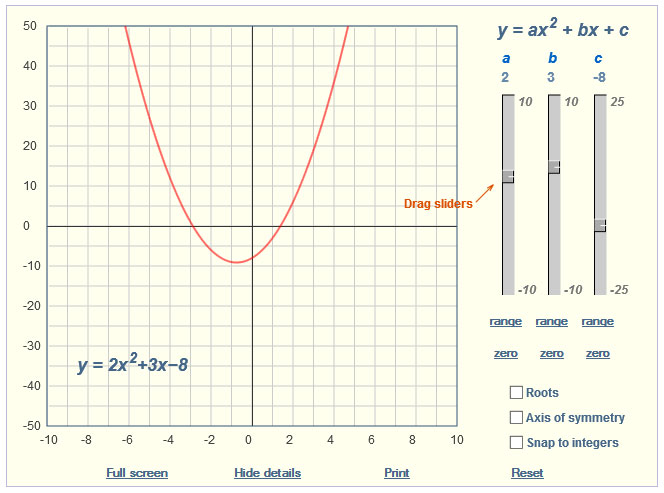
A quadratic function is any function that can be written in the form y = ax2 + bx + c, where a, b, and c are real numbers, and a ≠ 0. Its graph is a parabola. The constants a, b, and c are called the parameters of the equation. The values of a, b, and c determine the shape of the parabola.
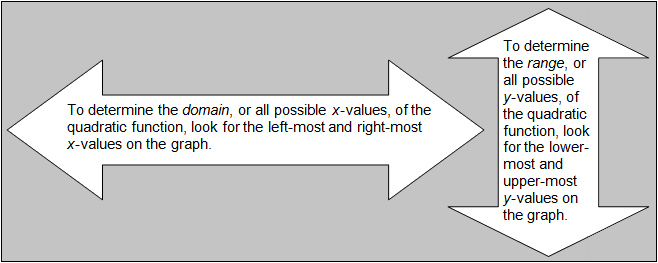
The domain of a function is the set of x-values that make that function true. The range of a function is the set of y-values that make that function true.
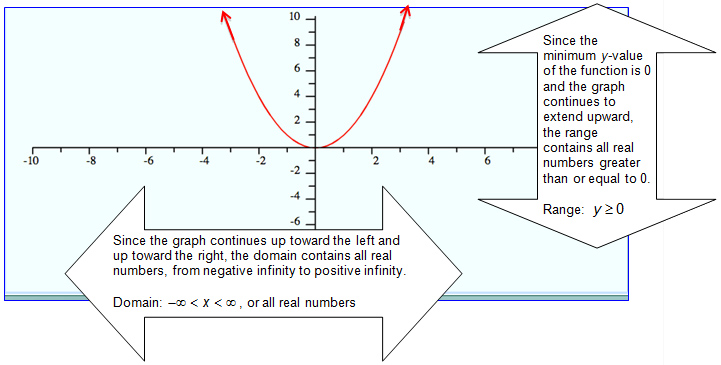
Example 1: The quadratic parent function is y = x2. The graph of this function is shown below.
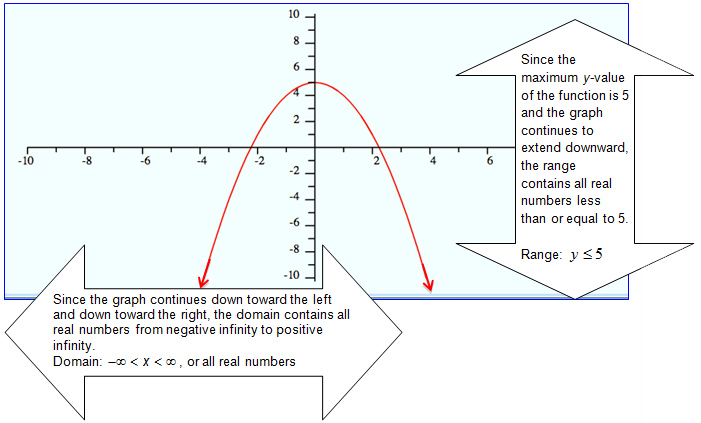
Example 2: The graph of y = -x2 + 5 is shown below. Determine the domain and range of this function.
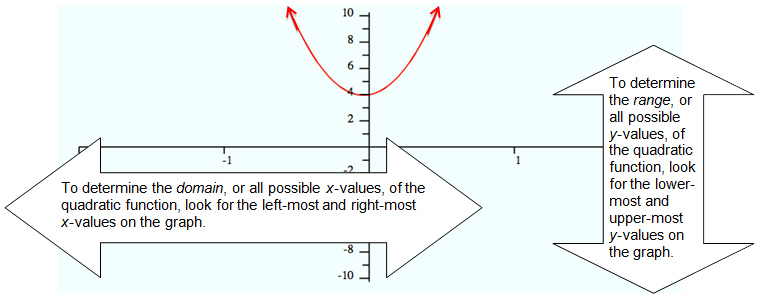
Example 3: The graph of y = 25x2 + 2x + 4 is shown below. Determine the domain and range of this function.
 Practice Activity—Drag and Drop
Practice Activity—Quadratic Function Explorer