This section provides an example of exponential growth using a population. A calculator is helpful.
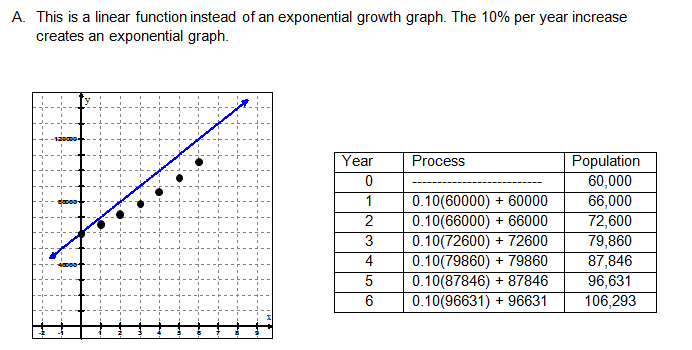
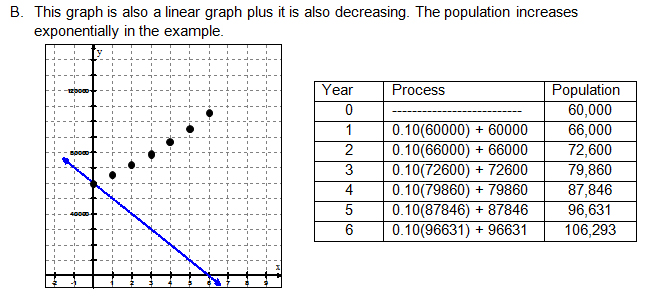
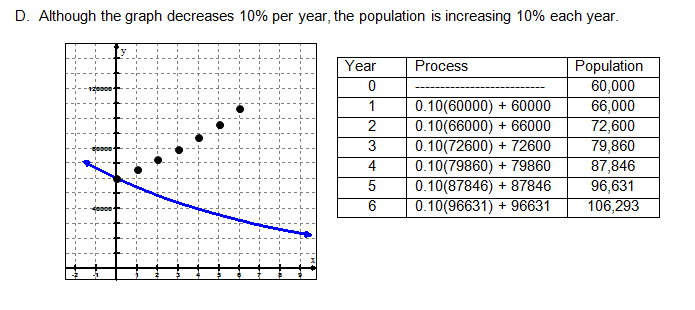
Example: The residents of Victoria, Texas, took a survey concerning their optimal rate for growth. The survey resulted in a desired growth rate of 10% per year.
Victoria, Texas, currently has 60,000 residents.
Graphing information:
Fill in the blanks below.
Click on the blanks to reveal the answers.
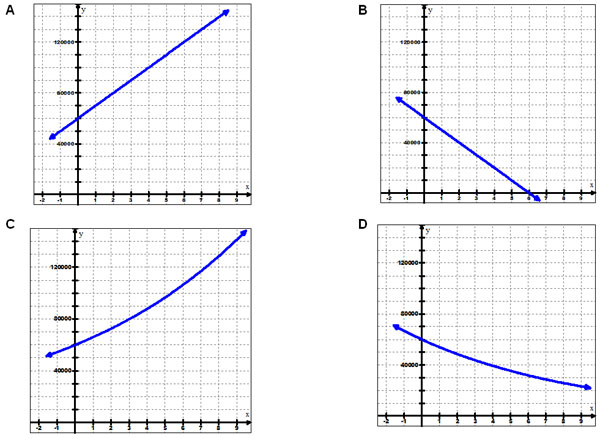
Using the information above, review the following graphs and select the graph representing the population exponential growth. After selecting the graph, read the descriptions of each graph below.
Interactive popup. Assistance may be required.

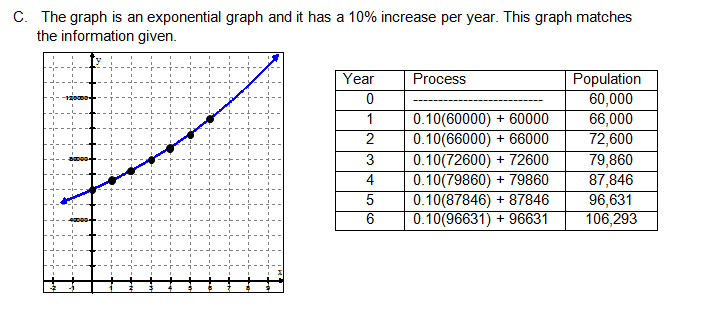
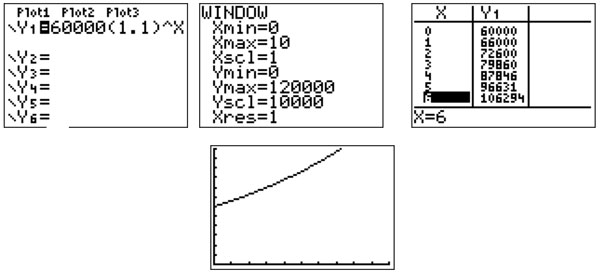
Put the equation in your calculator and graph. Go to the calculator’s table to see if it matches the given table. They should be the same.
Between what two years would the current population double? Interactive button. Assistance may be required. ____ Between 7 and 8 years